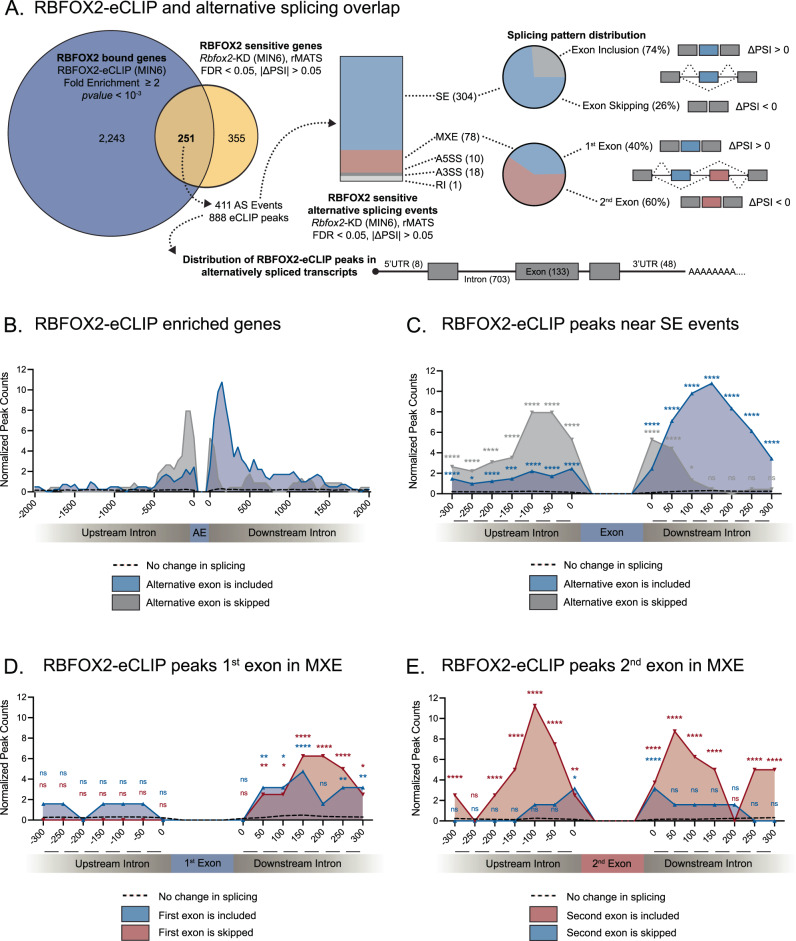
Fig. 5. Transcriptome wide assessment of RBFOX2 binding.
A Comparison of genes with one or more RBFOX2-eCLIP peaks identified by eCLIP-Seq with alternatively spliced transcripts from Rbfox2-KD in MIN6 cells identified by rMATs, cassette/skipped exon (SE), mutually exclusive exon (MXE), alternative 5’ start site (A5SS), alternative 3’ splice site (A3SS), or retained intron (RI) to identify RBFOX2 direct splicing targets, statistical significance was determined by rMATS for splicing analysis and Clipper for eCLIP analysis. B Distribution of RBFOX2 eCLIP-peaks relative to alternatively spliced included cassette exons (blue), skipped cassette exons (gray), or insensitive exons where splicing is not significantly changed between Rbfox2-KD and control (dashed line) 2000nt up and downstream of alternative exons. C Distribution of RBFOX2 eCLIP-peaks relative to alternatively spliced included cassette exons (blue), skipped cassette exons (gray), or insensitive exons where splicing is not significantly changed between Rbfox2-KD and control (dashed line) 300nt up and downstream of alternative exons. D Distribution of RBFOX2 eCLIP-peaks relative to alternatively spliced included 1st exon in mutually exclusive exons (blue), skipped 1st exon in mutually exclusive exons (red), or insensitive exons (dashed line). E Distribution of RBFOX2 eCLIP-peaks relative to alternatively spliced included 2nd exon in mutually exclusive exons (red), skipped 2nd exon in mutually exclusive exons (blue), or insensitive exons (dashed line). C–E Bootstrapping of eCLIP peaks at RBFOX2 insensitive exons was used to identify the probability and distribution of RBFOX2 binding events (peaks) and significant enrichment was calculated using a Poisson distribution, (ns FDR > 0.05, *FDR ≤ 0.05, **FDR ≤ 0.01, ***FDR ≤ 0.001, ****FDR < 0.0001).

