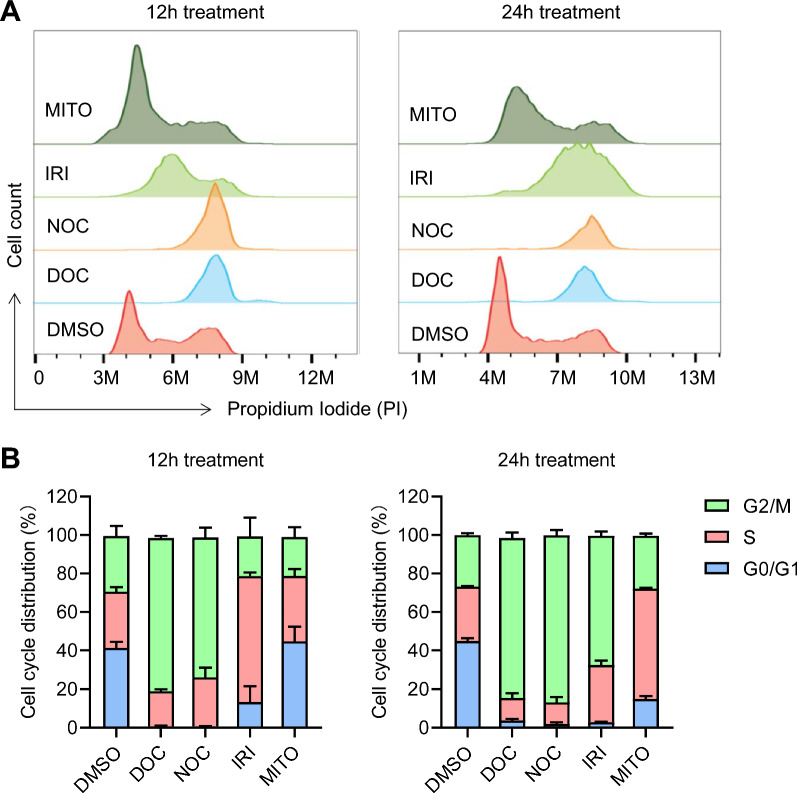
Fig. 1.
Cell cycle distribution analysis of 293T cells treated with small molecule inhibitors. A Analysis of 293T cells unsynchronized (DMSO) and synchronized by DOC (5 μM), NOC (2.5 μM), IRI (10 μM) and MITO (5 μM) for 12 (left panel) and 24 h (right panel) showing DOC and NOC arrested cells at G2/M stage and IRI and MITO increased the proportions at both S and G2/M phases of cell cycle. B Quantification of cell cycle distribution by measuring the area representing the specific cell cycle stage in FACS histogram. The mean values and error bars (SD) were calculated from three experiments

