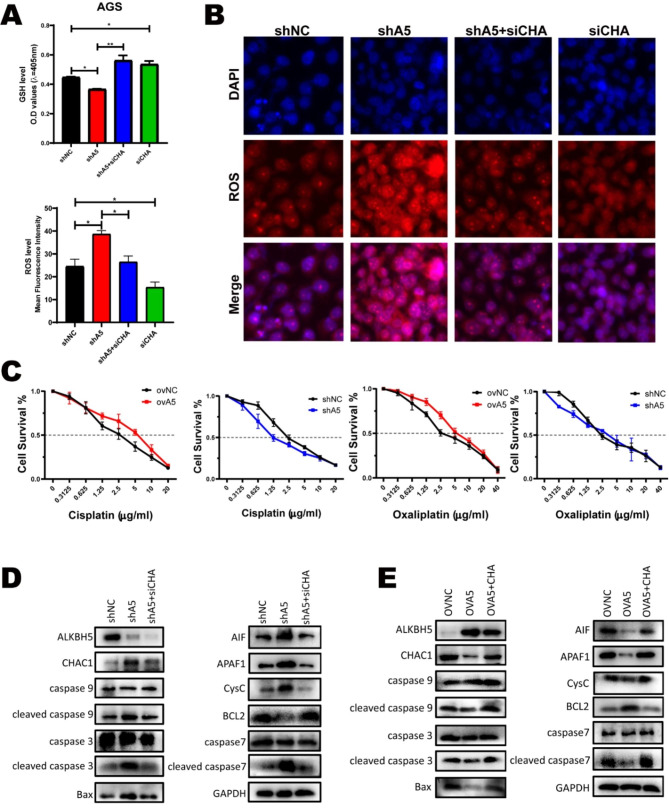
Fig. 7.
CHAC1 regulates the progression of ALKBH5 in GC and resisting cisplatin-induced ROS. (A) The total glutathione reagent kit was used to detect changes in GSH levels after treatment with knockdown of ALKBH5 and CHAC1. The average fluorescence intensity of each group in Fig. 7B was calculated by Image J software. (B) After treatment with 5ug/ml cisplatin for 36 h, the ROS probe was combined with the knockdown treated cells and the changes in ROS content were observed under the fluorescence microscope. (C) Cell survival was observed in the overexpression, knockdown, and control groups at different cisplatin(left), Oxaliplatin(right) concentrations, using a cell counting kit (CCK8) in MGC-803 cell line. (D) Western Blot was applied to detect changes in protein levels of markers commonly found in the mitochondrial apoptotic pathway in AGS cells with knockdown of ALKBH5 and CHAC1. (E) Western Blot was applied to detect changes in protein levels of markers commonly found in the mitochondrial apoptotic pathway in AGS cells with overexpression of ALKBH5 and CHAC1

