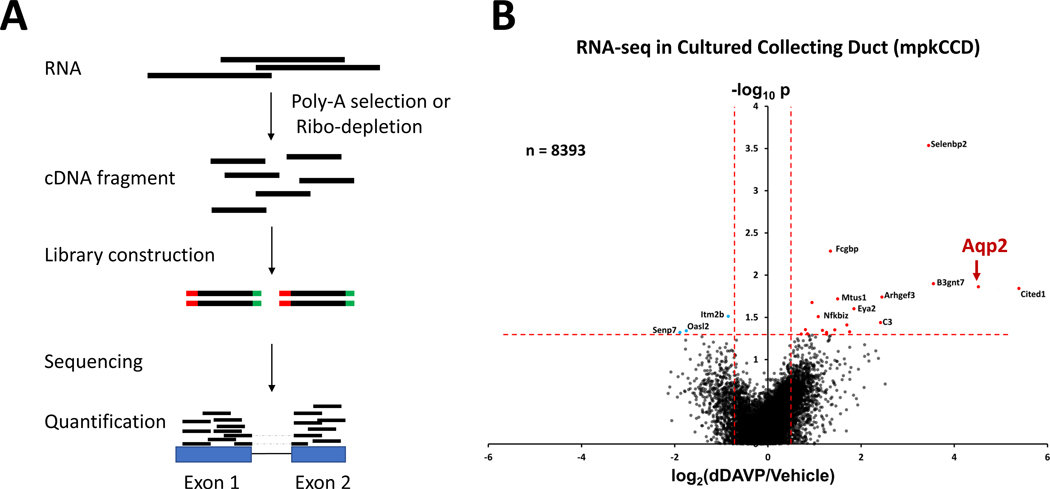
Figure 2. RNA-seq analysis of vasopressin signaling in mouse collecting duct cells (mpkCCD).
(A) A typical RNA-seq experiment starts with the selection of polyadenylated RNA transcripts using oligonucleotide (dT) primers (Poly-A selection) or depletion of high abundance ribosomal RNA (Ribo-depletion). The resulting RNA is then reverse transcribed to produce cDNA fragments, depending on the RNA-seq methods. Sequencing adapters (red and green bars) are then attached to the cDNA fragments to generate sequencing libraries through PCR amplification. The barcode libraries are deep sequenced using a high-throughput sequencing platform (e.g., Illumina) to obtain short sequencing reads. Sequencing reads, including exon and junction reads (reads with dashed lines), are subsequently aligned to the mouse reference genome to quantify gene expression. (B) Volcano plot for RNA-seq data for all 8393 detectable transcripts in dDAVP and vehicle-treated cells at 24 hrs. A relatively small number of transcripts, including Aqp2, were altered in abundance by vasopressin. The horizontal axis shows the mean log2(dDAVP/Vehicle) for 9 pairs of samples. The vertical axis shows −log10P for t-tests for each gene. Vertical dashed lines show 95% confidence interval for random variation based on Vehicle:Vehicle comparisons (2 × SD). Panel B was modified from Sandoval et al. (68).

