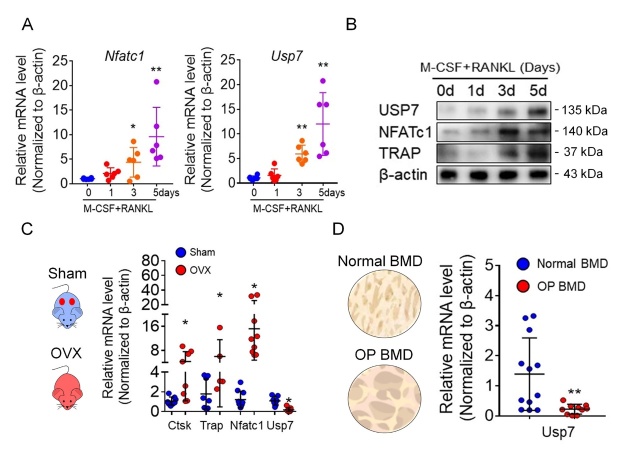
Figure 1.
The alteration of USP7 in osteoclastogenesis and osteoporosis samples. (A) The mRNA levels of Nftac1 and Usp7 in different stages of osteoclast formation analyzed by qPCR assay. Data are presented as the mean ± SD. *, P < 0.05. **, P<0.01. n=6. Student’s t-test analysis was used. (B) The protein levels of USP7, NFATc1 and TRAP during osteoclast formation analyzed by Western blot assay. Cells were lysed for performing western blot assay with the indicated antibodies. Blot assays were repeated three independent experiments. (C) The mRNA levels of Nftac1, Ctsk, Trap and Usp7 in femurs of sham and OVX mice analyzed by qPCR assay. Data are presented as the mean ± SD. *, P < 0.05. n=8 in each group. Student’s t-test analysis was used. (D) The mRNA levels of Usp7 in cancellus bone of femoral head from normal BMD and osteoporosis patients (T<-2.5) analyzed by qPCR assay. Data are presented as the mean ± SD. *, P < 0.05. n=12 in normal BMD group, n=10 in osteoporosis BMD group. Student’s t-test analysis was used.

