Figure 2.
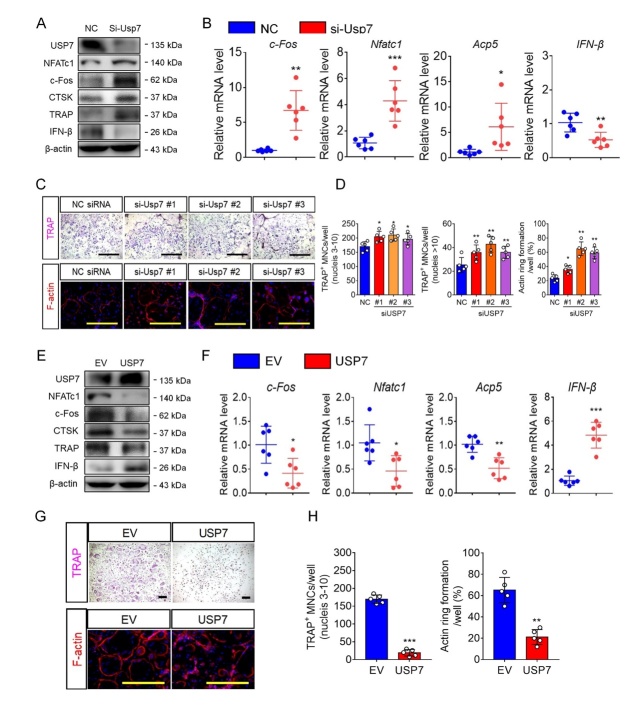
USP7 silencing promotes osteoclast formation and bone resorption. (A) Cells were harvested for performing western blot assay with antibodies against USP7, NFATc1, c-Fos, Cathepsin K, TRAP, and β-actin. Blot assays were repeated three independent experiments. (B) Quantitative RT-PCR analysis for Nfatc1, c-fos, Acp5 and IFN-β in NC siRNA-treated or Usp7 siRNA-treated cells. Data are presented as the mean ± SD. *, P < 0.05. **, P < 0.01. ***, P < 0.005. n=6 per group. Student’s t-test analysis was used. (C) BMMs transfected with NC siRNA or Usp7 siRNA were cultured with M-CSF and RANKL for 5 days, then cells were fixed and stained for TRAP or phalloidin. Scale bar = 100 μm. n=5 per group. (D) The number of TRAP-positive MNCs (3~10 nuclei per well or >10 nuclei per well) per well and the F-actin ring areas were analyzed. Data are presented as the mean ± SD. *, P < 0.05. **, P < 0.01. n=5 per group. Student’s t-test analysis was used. (E) BMMs were transfer with empty vector and Usp7 overexpression plasmid. Cells were harvested for performing western blot assay using antibodies against USP7, NFATc1, c-Fos, Cathepsin K, TRAP, and β-actin. (F) Quantitative RT-PCR analysis for Nfatc1, c-fos, Acp5 and IFN-β in EV control-transfected or USP7 overexpression vector-transfected cells. Data are presented as the mean ± SD. *, P < 0.05. n=6 per group. Student’s t-test analysis was used. (G) BMMs transfected with empty vector (EV) or USP7-plasmid were cultured with M-CSF and RANKL for 5 days, then cells were fixed and stained for TRAP. Scale bar = 100 μm. (H) The number of TRAP-positive MNCs (3~10 nuclei per well) per well and the area of F-actin rings were analyzed. Scale bar = 100 μm. Data are presented as the mean ± SD. **, P < 0.01. ***, P < 0.05. n=5 per group. Student’s t-test analysis was used.

