Figure 1.
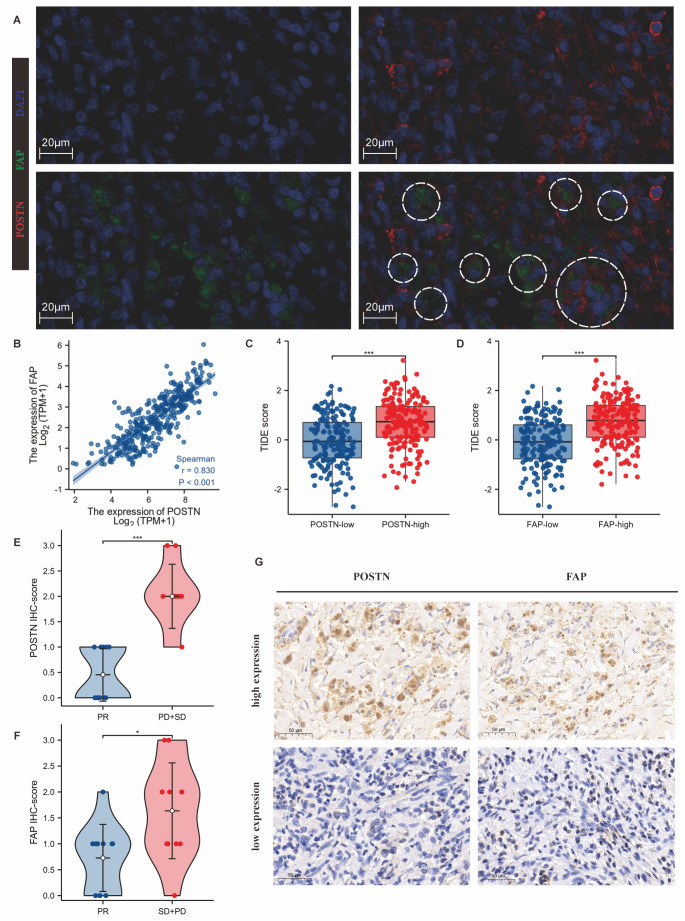
POSTN+FAP+ eCAFs conferred resistance to immune checkpoint blockade (ICB) in GC. (A) IF detection (n = 6) of POSTN and FAP double-positive CAF subpopulations in GC. Red: POSTN; Green: FAP; Blue: nucleus; White circle: typical FAP and POSTN double-positive CAFs. Scale bar: 20 μm. (B) The expression of POSTN was positively correlated with FAP expression in TCGA-STAD (p<0.001; Spearman’s rank). (C-D) High expression of POSTN (C) and FAP (D) was correlated with high TIDE scores. Red bars represent higher expression levels, and blue bars represent lower expression levels. ***, p<0.001; T test. (E-F) High expression of POSTN (E) and FAP (F) in GC was related to poor response to immunotherapy. PR: partial response; SD: stable disease; PD: progressive disease. Red bars represent the PD and SD groups, and blue bars represent the PR group (***, p<0.001; *, p<0.05; Wilcoxon rank sum test). (G) IHC staining (n = 22) of POSTN and FAP in GC tissue specimens (×40). Scale bar: 50 µm.

