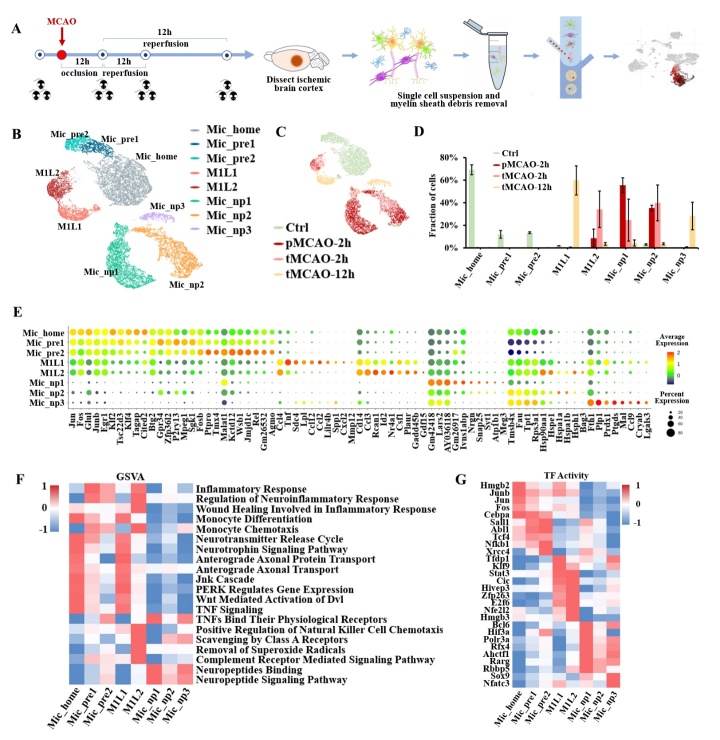
Figure 2.
Transcriptional landscape of microglia at the acute stage of ischemic stroke. (A) Schematic diagram of sample acquisition, single-cell RNA sequencing, and microglia identification. (Staining by Tmem119). (B) Uniform Manifold Approximation and Projection (UMAP) plot of the microglial subpopulations. (C) The temporal distribution of microglial cells in the UMAP plot. (D) Bar plot of the temporal abundance proportion of each subpopulation. (E) Dot plot displays signature markers of each subpopulation. (F) Heatmap of gene set variation analysis (GSVA) pathway enrichment for each subpopulation. (G) Heatmap of highly activated transcription factors (TF) for each microglial subpopulation.

