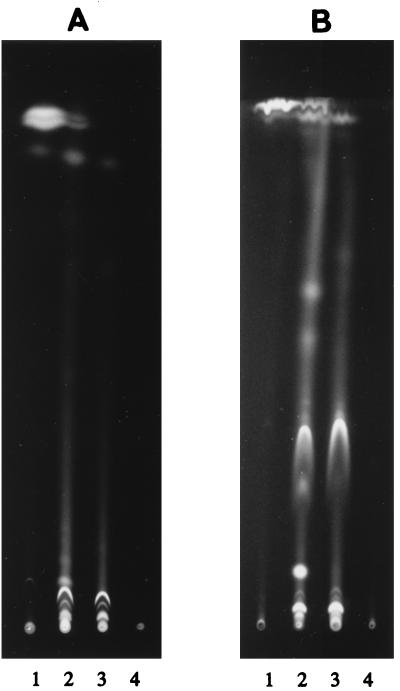
FIG. 2.
TLC profiles of benzo[a]pyrene metabolites during incubation in fungal cultures, as visualized by UV illumination. (A) Preparation developed twice with chloroform-methanol (97:3). (B) Metabolites which were retained near the origin in panel A after an additional run with chloroform-methanol (75:25). Lane 1, zero time; lanes 2 and 3, 1 and 15 days after addition of benzo[a]pyrene, respectively; lane 4, control fungal culture that did not receive benzo[a]pyrene.

