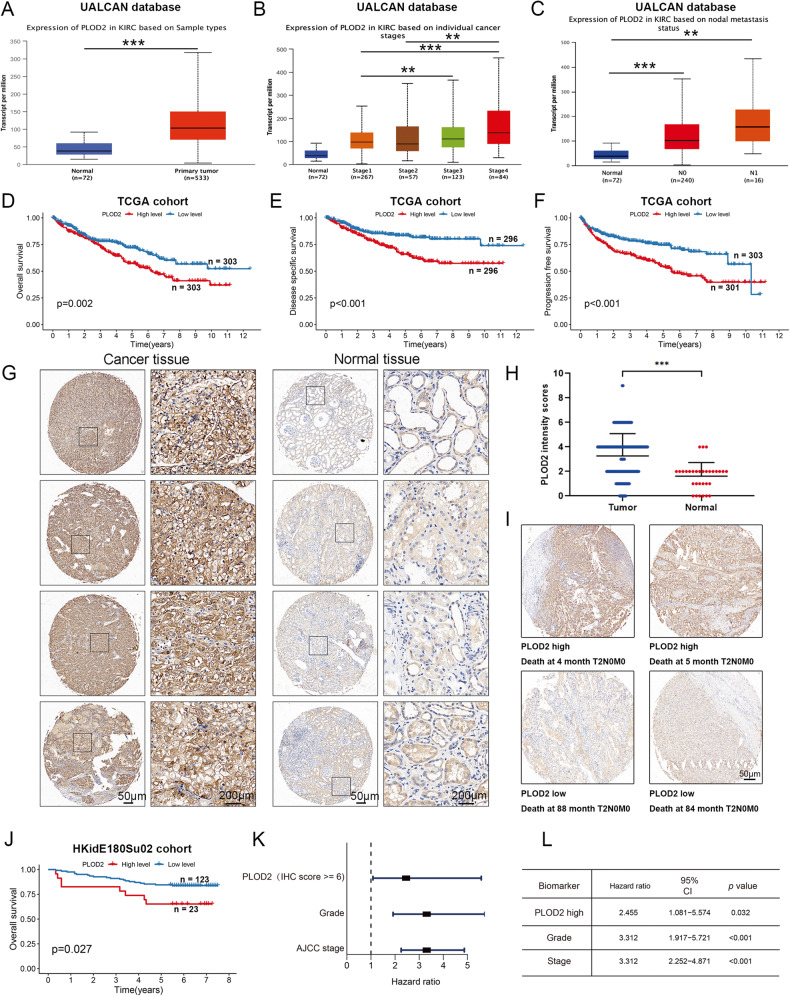
Fig. 3. High PLOD2 expression is associated with poor prognosis in patients with ccRCC.
A Differential expression of PLOD2 gene in ccRCC and normal kidney tissues. B PLOD2 expression is associated with higher tumor stage in ccRCC. C PLOD2 expression is associated with lymphatic metastasis in ccRCC. A–C Complete data are obtained from the UALCAN database. D–F Kaplan–Meier survival analysis of ccRCC patients from the TCGA datasets. Statistical significance was determined by the log-rank test of Kaplan–Meier analysis. G Representative PLOD2 IHC images of paired ccRCC tissue and adjacent tissues. The levels of PLOD2 in a ccRCC microarray from the Shanghai OUTDO Biotech (HKidE180Su02) were determined by immunohistochemical staining with an anti-PLOD2 antibody, as described in the “Methods”. Scale bar: 50 μm (second and fourth column); 200 μm (first and third column). H PLOD2 is highly expressed in ccRCC tissues compared with normal kidney tissue. The PLOD2 staining intensity was scored in 150 cancer tissues and 30 normal tissues, as described in the “Methods”. I Representative images showing high and low PLOD2 staining in the tissue microarray and the survival data of the corresponding patients. The patients included in the microarray were stratified by dichotomizing the PLOD2 expression status in cancer tissues on a continuous score scale of 0–12, with a cut point of 6. J Patients with ccRCC with high PLOD2 expression have significantly reduced overall survival. With a cut-off point of median score, Kaplan–Meier survival analysis was performed. K, L Patients with ccRCC with high PLOD2 expression (PLOD2 high) have significantly increased hazard ratios for death. Patients with ccRCC with low PLOD2 expression were used as the reference to calculate the hazard ratios for death. Statistical significance was assessed using two-tailed t tests. ***p < 0.001, **p < 0.01, *p < 0.05.

