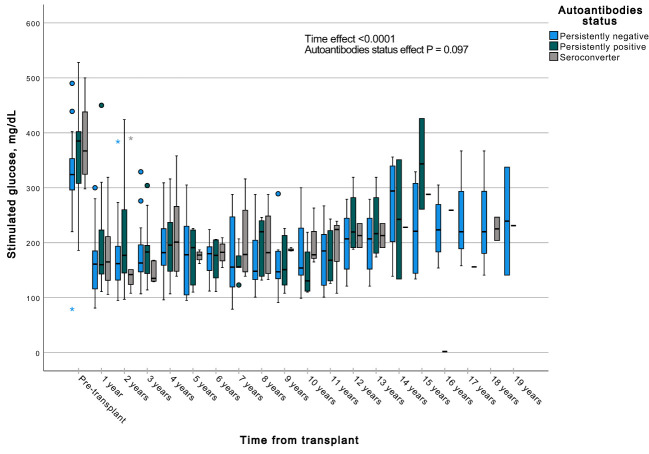
Figure 8.
Box plots illustrating the variations in stimulated glycemia across three groups (persistently negative, persistently positive, or seroconverters), demonstrating the temporal effect by comparing all time points with the pre-transplant period (P<0.0001). No significant impact of autoantibody status on fasting glycemia was observed (P=0.097), n=47. *Outliers.

