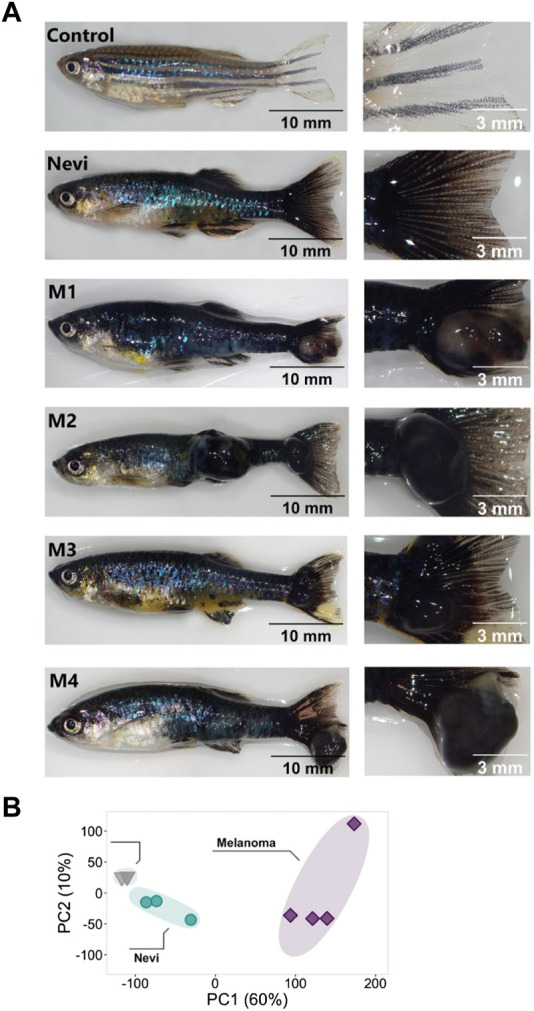
FIGURE 4.

Validation of the melanoma model and quantitative analysis of the DEGs at the nevi and melanoma stages (A) Zebrafish nevi and melanoma (M1-M4) models. The whole fish are shown on the left, and their caudal fins used to collect the nevi and melanoma tissue are shown on the right. For melanoma samples, nodular melanoma samples were selected. Tissue materials were collected from the caudal fins of four individuals for each group and used as biological replicates (no pooling). Scale bars are 10 mm (whole fish on the left) and 3 mm (close-ups on the right). (B) Principal component analysis (PCA) of nevi, melanoma, and their controls. Different colors of dots and triangles represent the sample condition. Three sample groups were well clustered among their replicates and separated from other sample groups. Principal Component 1 (PC1, x-axis) represents 60%, and PC2 (y-axis) represents 10% of the total variation in the data. PC, principal component.
