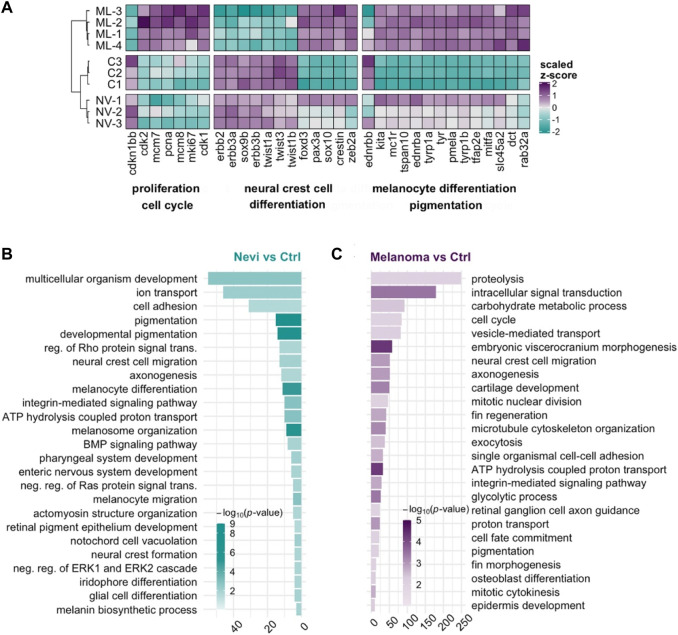
FIGURE 5.
Transcriptional profile of melanoma differs from that of nevi by the proliferative burst and oppositely regulated NCC signature (A) The heatmap shows the relative expression of selected genes between nevi (NV) and melanoma (ML) stages together with the control (C) group. Each column represents a single gene, and each row represents a biological replicate of each condition. The scale bar shows z-scores of vst-transformed counts from high to low expression, represented by a color gradient from purple to turquoise, respectively. (B,C) DAVID was used to show the 25 most significantly enriched GO-BP terms based on the transcriptional changes in nevi and melanoma comparisons. The color scale shows -log10 of the EASE p-value, and the x-axis shows the number of genes in each GO-BP term. DAVID, Database for Annotation, Visualization, and Integrated Discovery, GO, Gene ontology, BP, Biological process.

