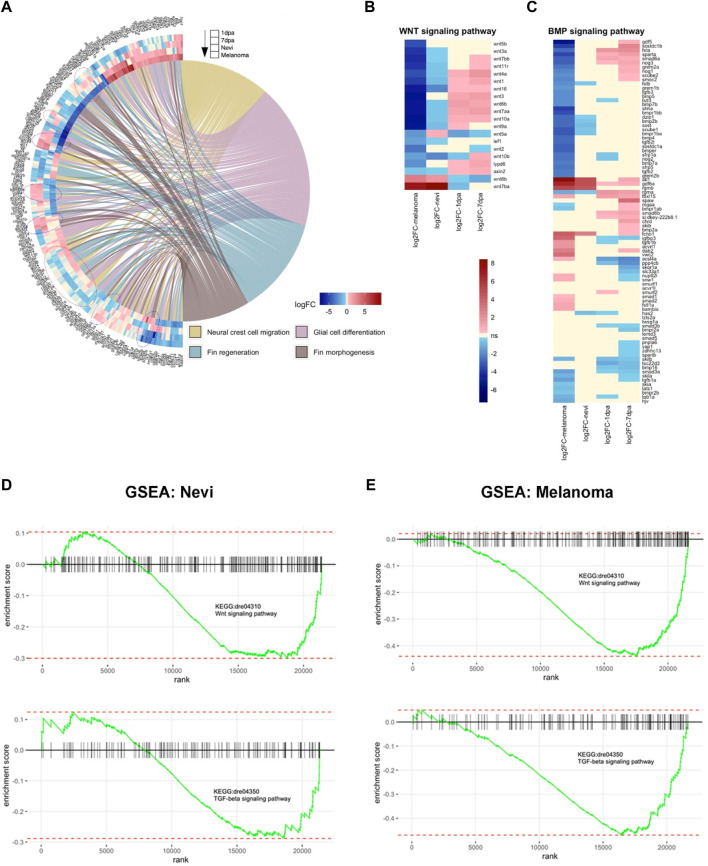
FIGURE 6.
Cellular processes, including Wnt and TGF-β/BMP signaling pathways, are differentially regulated between melanocyte regeneration and melanoma (A) GOChord plot shows log2 fold changes of the genes annotated in selected GO-BP terms for two stages of the melanocyte regeneration, nevi, and melanoma. The genes are linked to their assigned pathways by ribbons and ordered according to their log2 fold change values from low to high regulation, represented by a color gradient from blue to red, respectively. log2 fold changes are shown from the outer to the inner annulus in the following order, 1 dpa, 7 dpa, nevi, and melanoma. Blue dotted circles show clusters of DEGs that are oppositely regulated between 1 dpa/7 dpa and nevi/melanoma. Red dotted circles show clusters of DEGs that are oppositely regulated between 7 dpa and nevi/melanoma. (B,C) Heatmaps of selected genes in Wnt and BMP signaling pathways. Genes and conditions are clustered by the similarity of their differential expression profiles (log2 fold change). log2 fold change values are represented from high to low regulation by a color gradient from red to blue. Beige color represents non-significant differential expression (FC < 1.2 in both directions or FDR>0.1). (D) Gene Set Enrichment Analysis (GSEA) plots of Wnt and TGF-β signaling pathways for zebrafish nevi samples. (E) GSEA plots of Wnt and TGF-β signaling pathways for zebrafish melanoma samples. GSEA was performed, and enrichment plots were generated for selected gene sets using the fgsea package. On each enrichment plot, the horizontal black line represents the p-value ranks of genes with the most significant p-value rank on the left. The vertical black bars represent individual genes in the gene set and their ranks. The green curves represent the cumulative enrichment score (ES), and the red horizontal dashed lines show minimal and maximal scores. dpa, days post-ablation.

