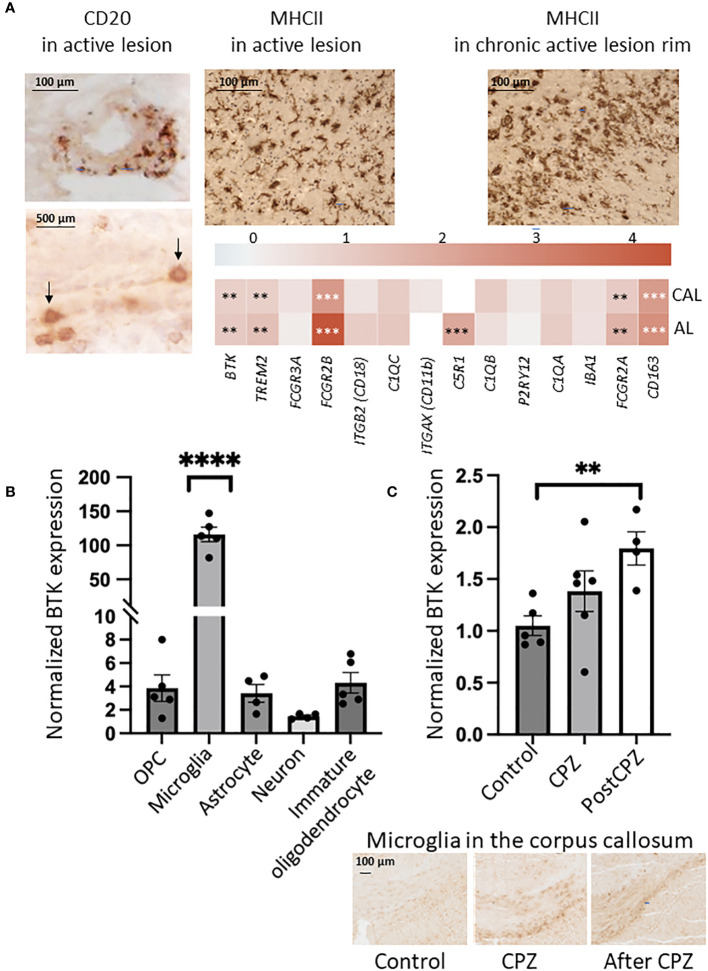
Figure 1.
(A) Immunohistochemistry indicated the presence of B cells (CD20, brown and arrows) and microglia/macrophages (MHCII) in the active lesion, and microglia/macrophages (MHCII, brown) in the rim of chronic active lesion. Expression of microglia genes (logFC) is shown in a heatmap in active (AL) and chronic active lesions (CAL): FDR less than 0.01 is marked with two stars (**), FDR less than 0.001 is marked with three stars (***). (B) BTK expression examined by quantitative PCR was increased in microglia isolated from postnatal mouse brain, while expression in other resident cells was minor. OPC: oligodendrocyte precursor cells. One-Way ANOVA corrected for multiple comparisons using the statistical hypothesis test “Tukey”. ****p<0.0001. (C) BTK expression examined by quantitative PCR was increasing during 6-week cuprizone (CPZ) treatment and 2 weeks after CPZ was stopped. Unpaired two-tailed t-test. **p<0.01. Presence of microglia in the corpus callosum during the three conditions was examined by Iba1 immunostaining.

