. 2020 Feb 12;133(3):jcs233791. doi: 10.1242/jcs.233791

Fig. 1.

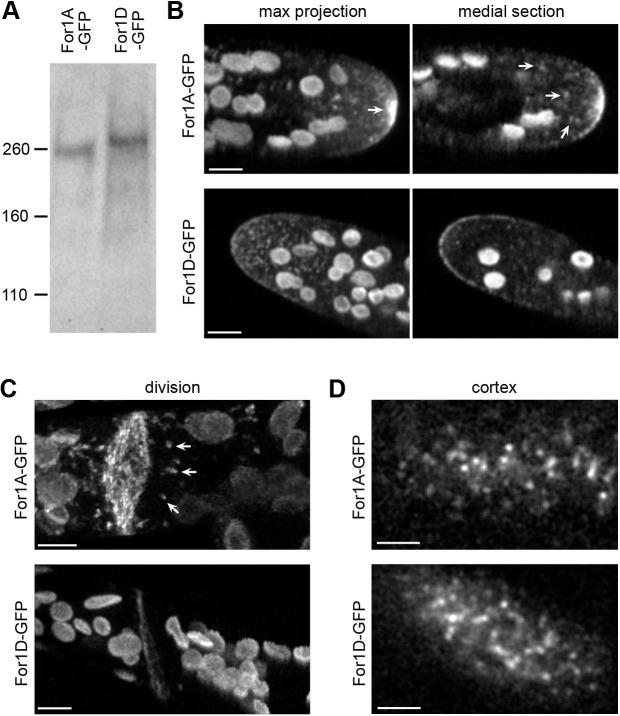
Fig. 1. Subcellular localization of endogenously tagged For1A and For1D. (A) Immunoblot performed with an antibody to GFP on whole-cell extracts from the For1A or For1D lines where the endogenous locus was tagged in frame with sequences encoding three tandem GFP molecules (GFP). The molecular mass in kDa is indicated. Expected sizes for unmodified proteins are: For1A–GFP, 232 kDa; For1D–GFP, 204 kDa. (B,C) Spinning-disc confocal images of For1A–GFP and For1D–GFP in the apical cell (B) and in a dividing cell (C, For1D–GFP) of a protonemal moss filament. (C, For1A–GFP). Laser scanning confocal images (de-noised with NIS elements software) during cell division. Maximum projections from confocal z-stacks are shown in B and C, and the medial plane is also shown in B. Arrows indicate cytoplasmic For1A–GFP accumulations and puncta. Large globular structures are chloroplasts, which display autofluorescence under these imaging conditions. Scale bars: 5 µm. (D) VAEM images of the cell cortex in the For1A–GFP and For1D–GFP lines. Scale bars: 2 µm. See also Movie 1.

Subcellular localization of endogenously tagged For1A and For1D. (A) Immunoblot performed with an antibody to GFP on whole-cell extracts from the For1A or For1D lines where the endogenous locus was tagged in frame with sequences encoding three tandem GFP molecules (GFP). The molecular mass in kDa is indicated. Expected sizes for unmodified proteins are: For1A–GFP, 232 kDa; For1D–GFP, 204 kDa. (B,C) Spinning-disc confocal images of For1A–GFP and For1D–GFP in the apical cell (B) and in a dividing cell (C, For1D–GFP) of a protonemal moss filament. (C, For1A–GFP). Laser scanning confocal images (de-noised with NIS elements software) during cell division. Maximum projections from confocal z-stacks are shown in B and C, and the medial plane is also shown in B. Arrows indicate cytoplasmic For1A–GFP accumulations and puncta. Large globular structures are chloroplasts, which display autofluorescence under these imaging conditions. Scale bars: 5 µm. (D) VAEM images of the cell cortex in the For1A–GFP and For1D–GFP lines. Scale bars: 2 µm. See also Movie 1.