. 2020 Feb 12;133(3):jcs233791. doi: 10.1242/jcs.233791

Fig. 7.

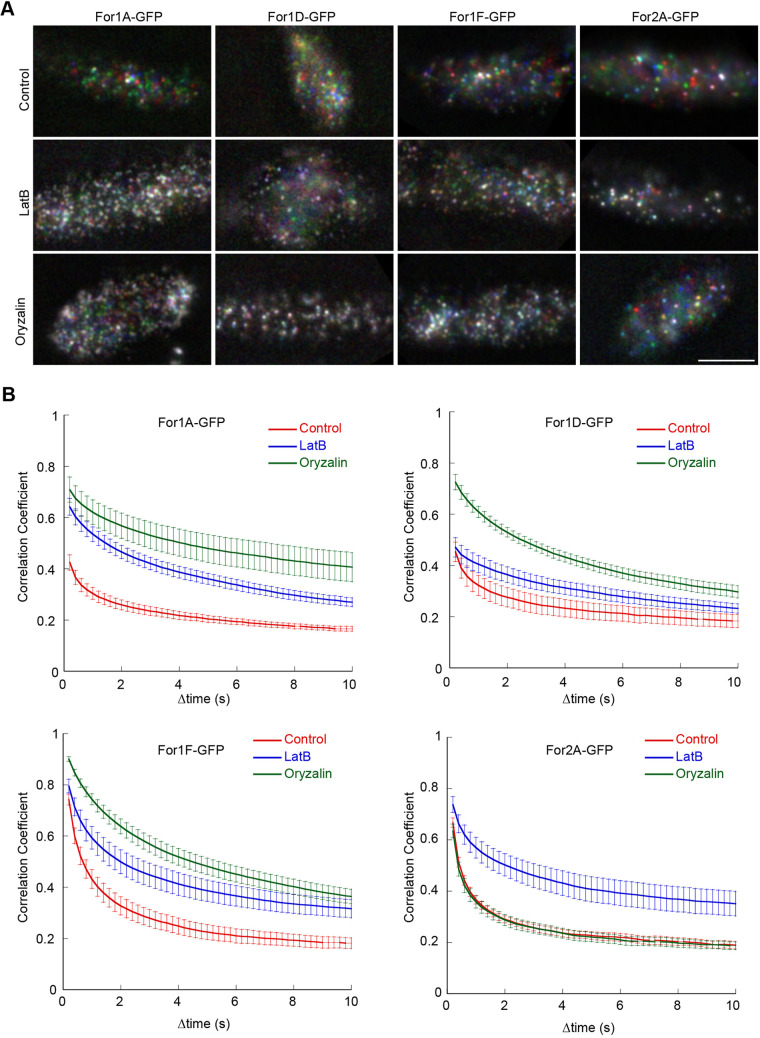
Fig. 7. Formins are differentially affected by cytoskeletal inhibitors. (A) VAEM imaging of endogenously tagged formins at the cell cortex. See also Movie 11. Three frames taken every 200 ms from a time-lapse acquisition were false-colored red, green and blue and then merged into a single image. Movement of cortical dots from one frame to the next appear colored in the merge. If the particle does not move, then the red–green–blue merge results in a white particle. Scale bar: 2 µm. (B) Quantification of cortical formin dynamics under the indicated conditions. The correlation coefficient between two images was calculated at all possible temporal spacings (time interval). Error bars represent s.e.m. (n=10 cells except for For1A control, n=9; For1D LatB, n=8; For2A LatB, n=11).

Formins are differentially affected by cytoskeletal inhibitors. (A) VAEM imaging of endogenously tagged formins at the cell cortex. See also Movie 11. Three frames taken every 200 ms from a time-lapse acquisition were false-colored red, green and blue and then merged into a single image. Movement of cortical dots from one frame to the next appear colored in the merge. If the particle does not move, then the red–green–blue merge results in a white particle. Scale bar: 2 µm. (B) Quantification of cortical formin dynamics under the indicated conditions. The correlation coefficient between two images was calculated at all possible temporal spacings (time interval). Error bars represent s.e.m. (n=10 cells except for For1A control, n=9; For1D LatB, n=8; For2A LatB, n=11).