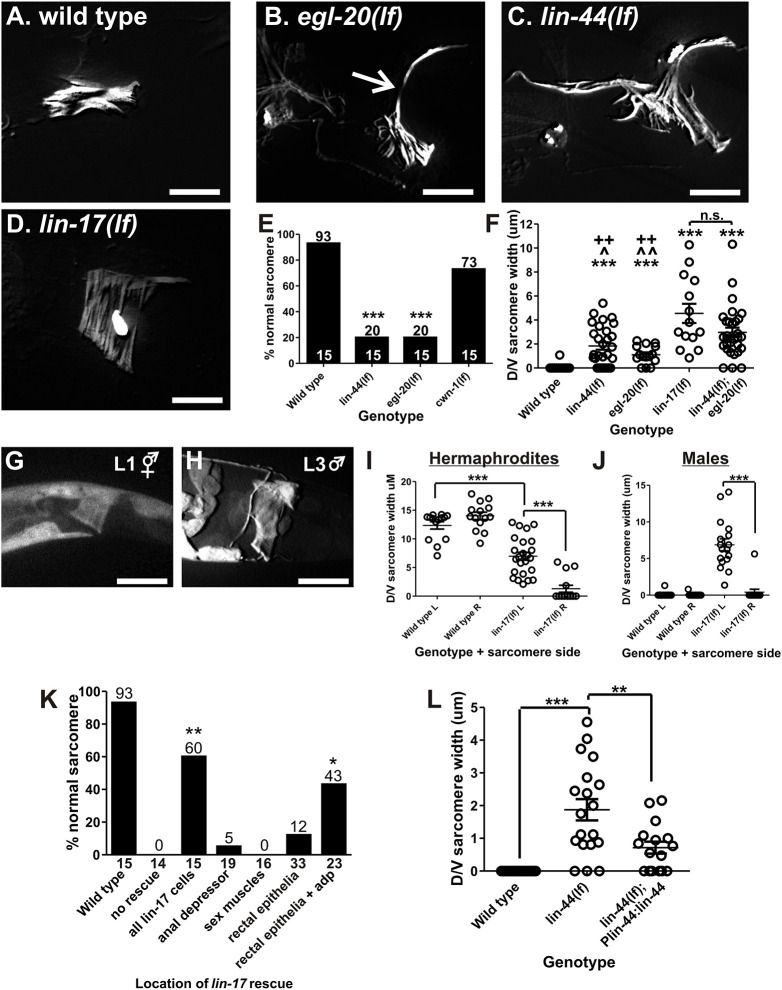
Fig. 3.
WNT mutant anal depressor defects. (A-D) Fluorescent image of YFP:actin in the wild-type (A), egl-20(lf) (B), lin-44(lf) (C) and lin-17 (D) anal depressors. The arrow in B indicates dorsal-ventral sarcomere width measured in F,I,J and L. (E) Graph depicting the percentage of males with normal sarcomeres in the indicated mutants. Numbers above the bars give the percentage and numbers above the x-axis represent the total sample number for each line. ***P<0.0001, Fisher's exact test, compared with wild type. (F) Graph depicting the severity of the remodeling defects. Each circle represents the dorsal/ventral sarcomere width of either the left or right dorsal attachment in one male (see arrow in B). Data are mean±s.e.m. ***P<0.0001, Mann–Whitney t-test compared with wild type. ^P<0.05, ^^P<0.005, Mann–Whitney t-test compared with lin-44(lf);egl-20(lf). ++P<0.005, Mann–Whitney t-test compared with lin-17(lf). n.s., not significant. (G,H) Fluorescent images of YFP expressed from the lin-17 promoter. The anal depressor is at the center of the image. (I,J) Left (L) and right (R) dorsal-ventral sarcomere width in adult anal depressors. Each circle represents the width of the sarcomere on the indicated side of an individual animal. ***P<0.0001, Mann–Whitney t-test. (K) Graph depicting the percentage of males with normal sarcomeres. The x-axis indicates where wild-type lin-17 cDNA is expressed. The numbers on top of the bars represent the percentages. The number below the x-axis represents the total sample number for each location. *P<0.05, **P<0.005, Fisher's exact test, compared with no rescue. (L) lin-44(lf) anal depressor defects are rescued with a transgene. Each circle represents the dorsal/ventral sarcomere width of either the left or right dorsal attachment in one male (see arrow in C). Data are mean±s.e.m. **P<0.005, ***P<0.0001, Mann–Whitney t-test. For all images, dorsal is up and anterior is to the left. Scale bars: 10 µm.

