. 2020 May 13;147(9):dev181305. doi: 10.1242/dev.181305

Fig. 5.

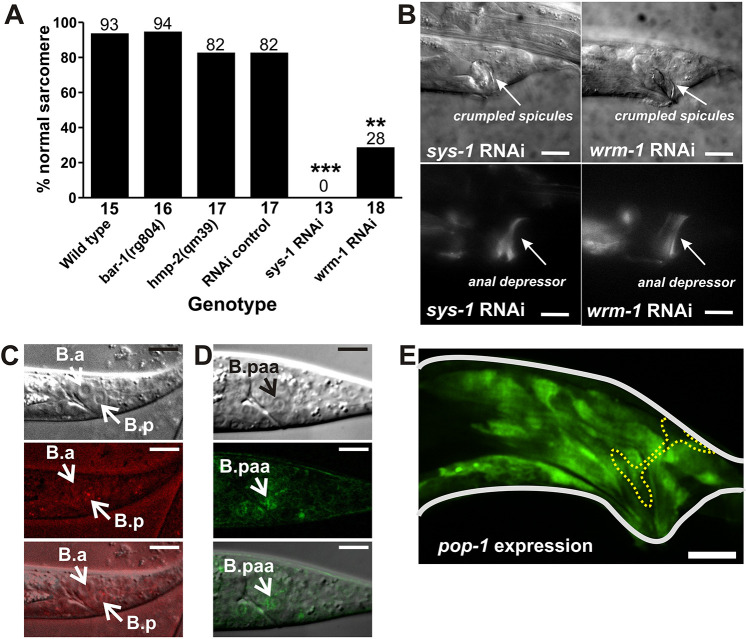
Fig. 5. β-Catenin functions in cells outside the anal depressor to regulate disassembly. (A) Graph depicting the percentage of males with normal sarcomeres (complete dorsal-ventral disassembly). Numbers above the bars indicate the percentage and the numbers below the x-axis represent the total sample number for each genotype. **P<0.005, ***P<0.0001, Fisher's exact test. (B) DIC (top) and fluorescent (bottom) images of YFP:actin-expressing male tails developed in sys-1 and wrm-1 RNAi-expressing bacteria. Arrows indicate the spicules (DIC images) or the anal depressor (fluorescent images). (C) DIC (top) and fluorescent (middle) images of SYS-1:mcherry in the nucleus of B.p of a late L1 male. Bottom image is the top and middle images combined. Arrows indicate B.a and B.p. (D) DIC (top) and fluorescent (middle) images of WRM-1:GFP in the B.paa cell (arrow) of a L3 male. Bottom image is the top and middle images combined. (E) Fluorescent image of YFP expressed by the pop-1 promoter. Adult male tail outlined in white. Anal depressor outlined by a yellow dashed line. Scale bars: 10 µm.

β-Catenin functions in cells outside the anal depressor to regulate disassembly. (A) Graph depicting the percentage of males with normal sarcomeres (complete dorsal-ventral disassembly). Numbers above the bars indicate the percentage and the numbers below the x-axis represent the total sample number for each genotype. **P<0.005, ***P<0.0001, Fisher's exact test. (B) DIC (top) and fluorescent (bottom) images of YFP:actin-expressing male tails developed in sys-1 and wrm-1 RNAi-expressing bacteria. Arrows indicate the spicules (DIC images) or the anal depressor (fluorescent images). (C) DIC (top) and fluorescent (middle) images of SYS-1:mcherry in the nucleus of B.p of a late L1 male. Bottom image is the top and middle images combined. Arrows indicate B.a and B.p. (D) DIC (top) and fluorescent (middle) images of WRM-1:GFP in the B.paa cell (arrow) of a L3 male. Bottom image is the top and middle images combined. (E) Fluorescent image of YFP expressed by the pop-1 promoter. Adult male tail outlined in white. Anal depressor outlined by a yellow dashed line. Scale bars: 10 µm.