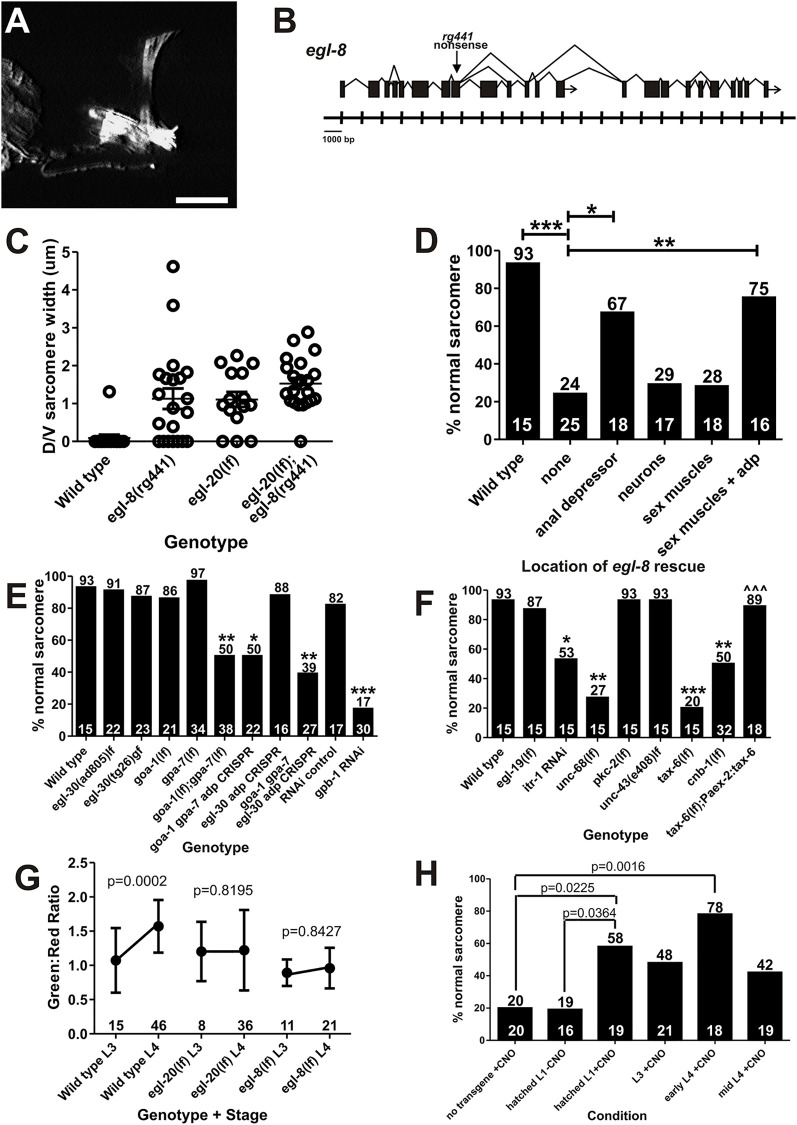
Fig. 6.
PLC-β/EGL-8 promotes calcium release from internal stores to regulate anal depressor sarcomere disassembly. (A) Fluorescent image of egl-8 mutant adult male anal depressor expressing YFP:actin. Dorsal is up and anterior is to the left. Scale bar: 10 µm. (B) Genomic structure and splice variants of egl-8 with the location of the rg441 allele in exon 8 indicated by the downward pointing arrow. Tick marks denote DNA base pairs in thousands. (C) Graph depicting the severity of disassembly defect. Each circle represents the dorsal-ventral sarcomere width of either the left or right dorsal attachment in one male. Data are mean±s.e.m. (D) Graph depicting the percentage (numbers on top of bars) of males with normal sarcomeres. The x-axis indicates where the wild-type egl-8 minigene is expressed. adp, anal depressor. The numbers above the x-axis represent the total sample number for each location. *P<0.05, **P<0.005, ***P<0.0005, Fisher's exact test. (E,F) Graphs depicting the percentage (numbers on top of bars) of males with normal sarcomeres. The numbers above the x-axis represent the total sample number for each genotype/stage. *P<0.05, **P<0.005, ***P<0.0001, Fisher's exact test, compared with wild type. itr-1 RNAi and pkc-2(lf) were scored using an Punc-103E:YFP:actin expressing transgene (Chen and García, 2015). (G) Calcium transients in the anal depressor monitored by measuring changes in G-CaMP fluorescence (green) normalized to an unchanging RFP control (red). Each dot indicates a time point where males were averaged±s.d. The x-axis represents genotype and developmental stage. The numbers above the x-axis represent the total sample number for each genotype/stage. P-values were determined using the Mann-Whitney t-test. (H) Percentage of adult ceDREADD-expressing egl-20(lf) males with a fully remodeled anal depressor. Males other than the ‘no transgene +CNO’ control have Paex-2:ceDREADD expressed from a transgene. x-axis indicates the developmental stage during which the males were first exposed to CNO. The numbers on top of the bars indicate the percentage of adult males with a normal sarcomere. The numbers above the x-axis indicate the total sample number for each condition. P-values were determined using Fisher's exact test.

