. 2020 Apr 12;147(8):dev184655. doi: 10.1242/dev.184655

Fig. 4.

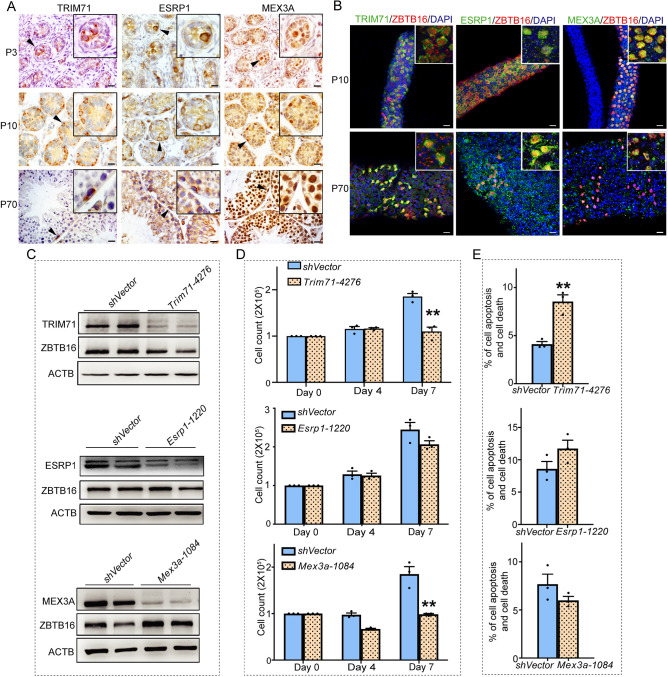
Fig. 4. Localization of TRIM71, ESRP1 and MEX3A expression in mouse testes. (A) Representative images of immunohistochemical staining for TRIM71, ESRP1 and MEX3A in cross-sections of mouse testes during neonatal (P3), prepubertal (P10) and adult (P70) stages of development. Insets show magnification of the area where the positive cells are located. Arrowheads indicate the positive cells. (B) Whole-mount immunofluorescence staining for TRIM71, ESRP1 and MEX3A expression in undifferentiated spermatogonia based on colocalization with the marker ZBTB16. Insets show magnification of the area where the positive cells are located. (C) Representative images of western blot analysis for knockdown efficiency of TRIM71, ESRP1 and MEX3A levels 7 days after gene-specific shRNA treatment compared with non-targeting shRNA control (shVector). ACTB level was assessed as a loading control. (D) Quantification of total cell number in primary cultures of undifferentiated spermatogonia at 0, 4 and 7 days after treatment with Trim71, Esrp1 or Mex3a shRNA to knock down expression. (E) Quantification of apoptotic and dead cells in primary cultures of undifferentiated spermatogonia at 7 days after treatment with Trim71, Esrp1 or Mex3a shRNA. All data are mean±s.e.m. for n=3 different cultures. *P<0.05, **P<0.01 (Student's t-test). Scale bars: 20 μm.

Localization of TRIM71, ESRP1 and MEX3A expression in mouse testes. (A) Representative images of immunohistochemical staining for TRIM71, ESRP1 and MEX3A in cross-sections of mouse testes during neonatal (P3), prepubertal (P10) and adult (P70) stages of development. Insets show magnification of the area where the positive cells are located. Arrowheads indicate the positive cells. (B) Whole-mount immunofluorescence staining for TRIM71, ESRP1 and MEX3A expression in undifferentiated spermatogonia based on colocalization with the marker ZBTB16. Insets show magnification of the area where the positive cells are located. (C) Representative images of western blot analysis for knockdown efficiency of TRIM71, ESRP1 and MEX3A levels 7 days after gene-specific shRNA treatment compared with non-targeting shRNA control (shVector). ACTB level was assessed as a loading control. (D) Quantification of total cell number in primary cultures of undifferentiated spermatogonia at 0, 4 and 7 days after treatment with Trim71, Esrp1 or Mex3a shRNA to knock down expression. (E) Quantification of apoptotic and dead cells in primary cultures of undifferentiated spermatogonia at 7 days after treatment with Trim71, Esrp1 or Mex3a shRNA. All data are mean±s.e.m. for n=3 different cultures. *P<0.05, **P<0.01 (Student's t-test). Scale bars: 20 μm.