


Figure 3.
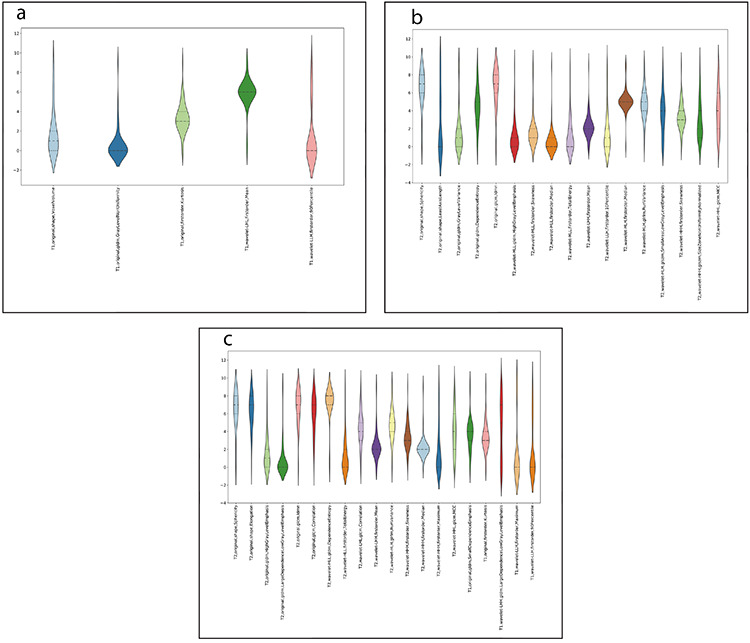
The distribution of the selected features from contrast-enhanced T1-weighted images (a), T2-weighted images (b), and the combined group (c) after the data preprocessing steps.
Official websites use .gov
A
.gov website belongs to an official
government organization in the United States.
Secure .gov websites use HTTPS
A lock (
) or https:// means you've safely
connected to the .gov website. Share sensitive
information only on official, secure websites.
The distribution of the selected features from contrast-enhanced T1-weighted images (a), T2-weighted images (b), and the combined group (c) after the data preprocessing steps.