


Figure 4.
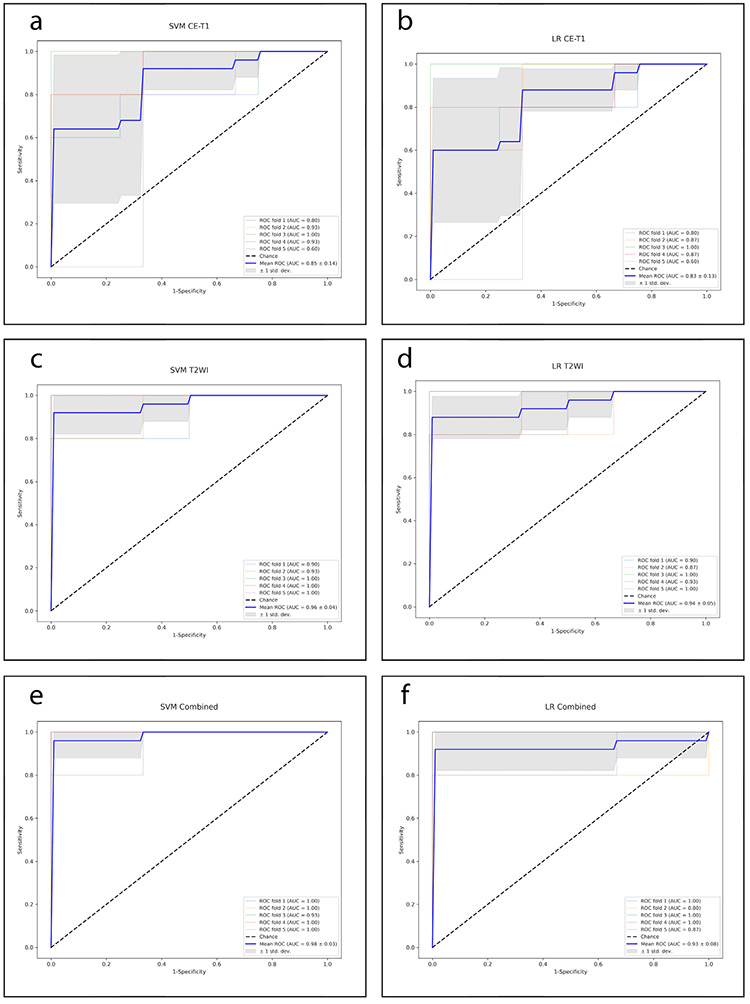
(a-f) The ROC curves achieved in all the models for each test fold. SVM, support vector machine; LR, logistic regression; CE-T1, contrast-enhanced T1 images; T2WI, T2- weighted images; ROC, receiver operating characteristic; AUC, area under the receiver operating characteristics curve.