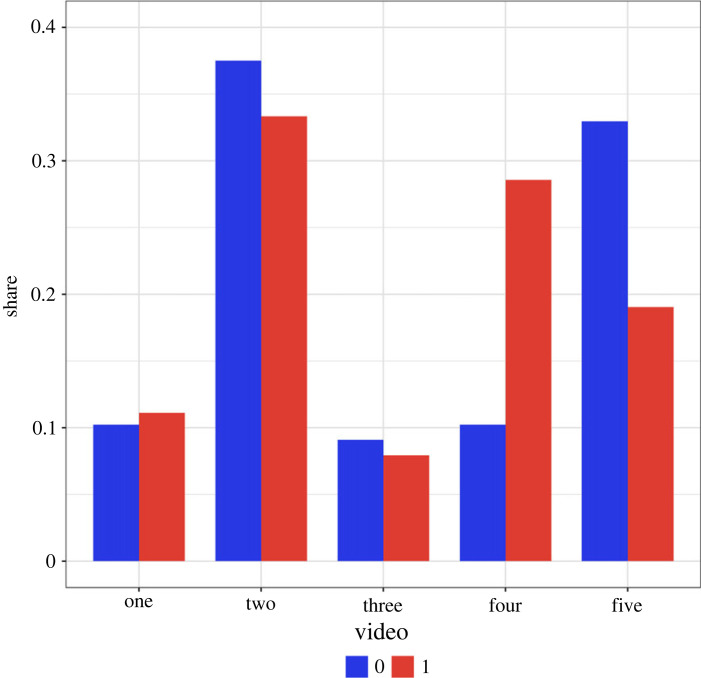
Figure 3.
Distribution of videos selected as ‘out of the ordinary’. Notes: The distribution of videos identified as out of the ordinary by participants in the control and first experimental treatment conditions. The sample is the subset of participants who indicated having observed something out of the ordinary. These participants were asked to identify which videos were out of the ordinary, with the option to select more than one video. The blue bars represent the control group, who viewed five authentic videos. The red bars represent the treatment group, who viewed four authentic videos and one deepfake (the fourth video).

