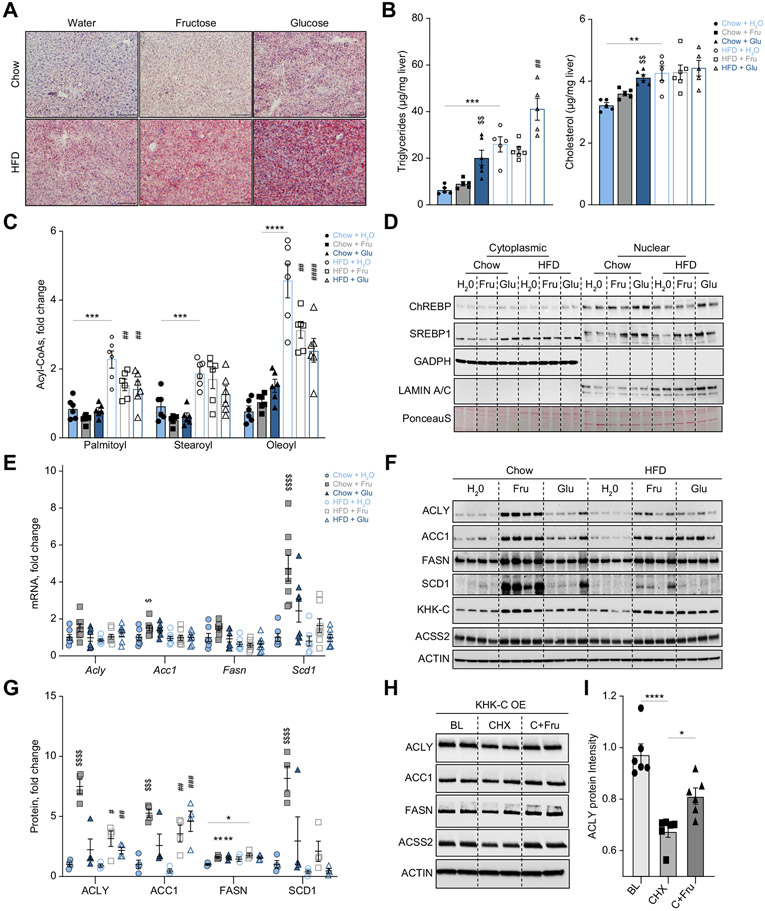
Fig. 1. Sugar supplementation of a HFD worsens hepatic steatosis.
(A) Representative Oil red-O staining to assess neutral lipid accumulation across all groups. Scale bar = 20 μm. (B) Hepatic triglyceride and cholesterol levels were quantified enzymatically (n = 5-6). (C) Long-chain acyl-CoA levels quantified by mass spectrometry (n = 6). (D) Representative cytoplasmic and nuclear protein was blotted for ChREBP, SREBP1, GAPDH (cytoplasmic control), and Lamin A/C (nuclear control). (E) Liver mRNA levels of Acly, Acc1, Fasn, and Scd1 were quantified by qPCR (n = 7-8). (F, G) Protein levels of ACLY, ACC1, FASN, SCD1, KHK–C, and ACSS2 were measured by western blot (F) and quantified using densitometry (G; n = 4). (H) KHK–C-overexpressing hepG2 hepatocytes were treated with 25 μg/ml of cycloheximide (CHX) or CHX+25 mM fructose (C+Fru) for 4 h. After 4-hour incubation, protein levels of ACLY, ACC1, FASN, ACSS2, and ACTIN (loading control) were measured using western blot. Baseline (BL) was compared to CHX and C+Fru treatment. (I) Densitometry quantification of ACLY protein in Fig. 1H and Fig. S2E. Significance was determined by two-way ANOVA with Sidak’s post hoc analysis of sugar supplementation (H2O, Fru, Glu) and solid diet (chow and HFD). Significance denoted with ($) compares sugar-supplemented groups to their chow+H2O control (*) comparing HFD+H2O to chow+H2O group or the difference between adjacent groups using a post hoc Student’s t test, and lastly (#) denotes significance of sugar-supplemented groups compared to their HFD+H2O control. #p<0.05; ##p<0.01; ###p<0.001; ####p<0.0001.

