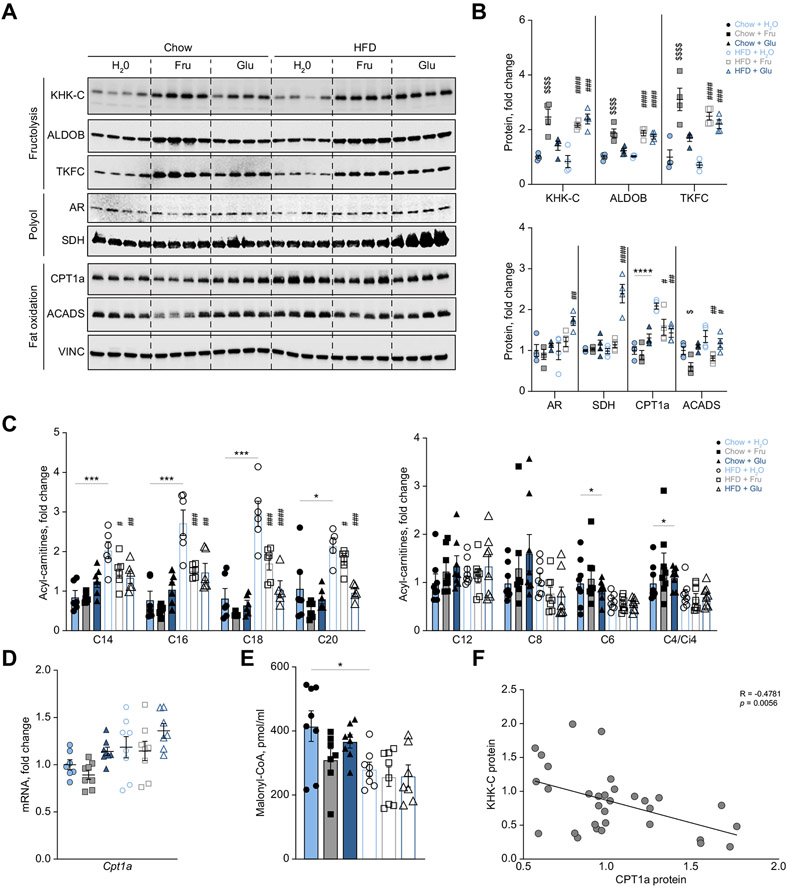
Fig. 3. KHK–C is inversely associated with CPT1α protein and long-chain acylcarnitine levels.
(A-B) Protein levels measured by western blot (A) of fructolysis (KHK–C, ALDOB, TKFC), polyol (AR, SDH), and fat oxidation proteins (CPT1α, ACADS), and quantified by densitometry (B) normalized to vinculin (VINC) loading control (n = 4). (C) Hepatic long-chain acylcarnitine levels measured by GC-MS (n = 5-6). (D) Liver CPT1α mRNA expression across the six groups (n = 8). (E) Hepatic malonyl-CoA levels quantified by mass spectrometry (n = 8). (F) Linear regression analysis using KHK–C and CPT1α protein normalized to vinculin from panel A (n = 24) and from db/db mice (Fig. S5D; n = 8 for a total of 32 samples included in the linear regression). Significance was determined by two-way ANOVA with Sidak’s post hoc analysis of sugar supplementation (H2O, Fru, Glu) and solid diet (Chow and HFD). Significance denoted with ($) compares sugar-supplemented groups to their chow+H2O control (*) comparing HFD+H2O to chow+H2O group or the difference between adjacent groups using a post hoc Student’s t test, and lastly (#) denotes significance of sugar-supplemented groups compared to their HFD+H2O control. #p<0.05; ##p<0.01; ###p<0.001; ####p<0.0001.

