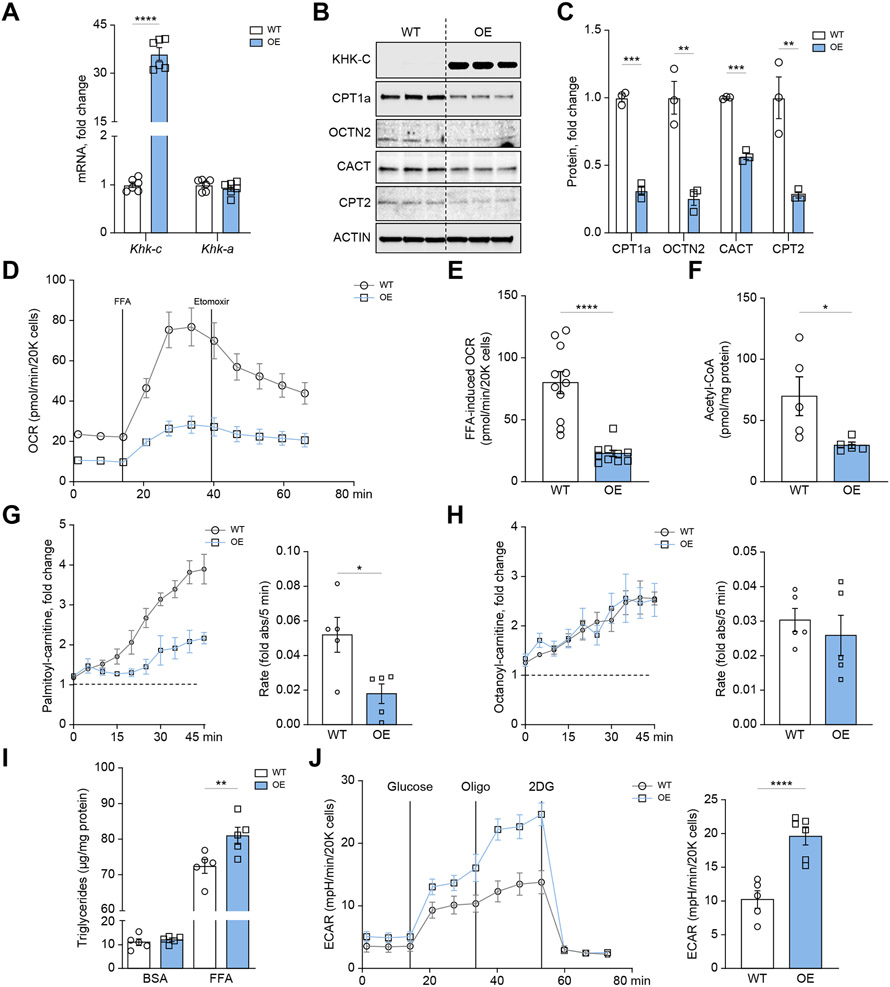
Fig. 4. Ketohexokinase-C overexpression impairs long-chain fatty acid oxidation in mouse hepatocytes.
(A) qPCR was used to measure Khk-c and Khk-a mRNA levels in WT and KHK–C-overexpressing AML12 hepatocytes (n = 6) (B–C) KHK–C and carnitine shuttle/FAO proteins (CPT1α, OCTN2, CACT, CPT2) assessed by western blot (B) and quantified by densitometry using actin as a loading control (C; n = 3) (D-E) Seahorse fatty acid oxidation assay (D) recording oxygen consumption rate (OCR) in WT and KHK–C-overexpressing AML12 hepatocytes upon stimulation with free fatty acids (FFAs) and treated with the CPT1α inhibitor etomoxir (E; n = 10-11) (F) Acetyl-CoA levels were quantified in WT and KHK–C-overexpressing AML12 hepatocytes (n = 5). (G-H) Mitosubstrate assay from BioLog quantifying palmitoyl-carnitine (G) and octanoyl-carnitine (H) utilization in WT and KHK–C-overexpressing AML12 cells (n = 5). The panels to the right quantify the rate of substrate utilization over 45 min. (I) Triglycerides were quantified enzymatically from WT and KHK–C-overexpressing cells treated with BSA or 0.4 mM FFA for 24 h (n = 6). (J) Seahorse glycolysis assay recording extracellular acidification rate (ECAR) in WT and KHK–C-overexpressing cells in response to glucose, oligomycin (Oligo), and 2-deoxyglucose (2DG). Glycolysis is quantified in the panel on the right as area under curve. Significance was determined using unpaired, Student’s t test. For panel I, significance was determined by two-way ANOVA with Sidak’s post hoc analysis comparing OE vs. WT groups. Significance is defined as *p<0.05; **p<0.01; ***p<0.001; ****p<0.0001.

