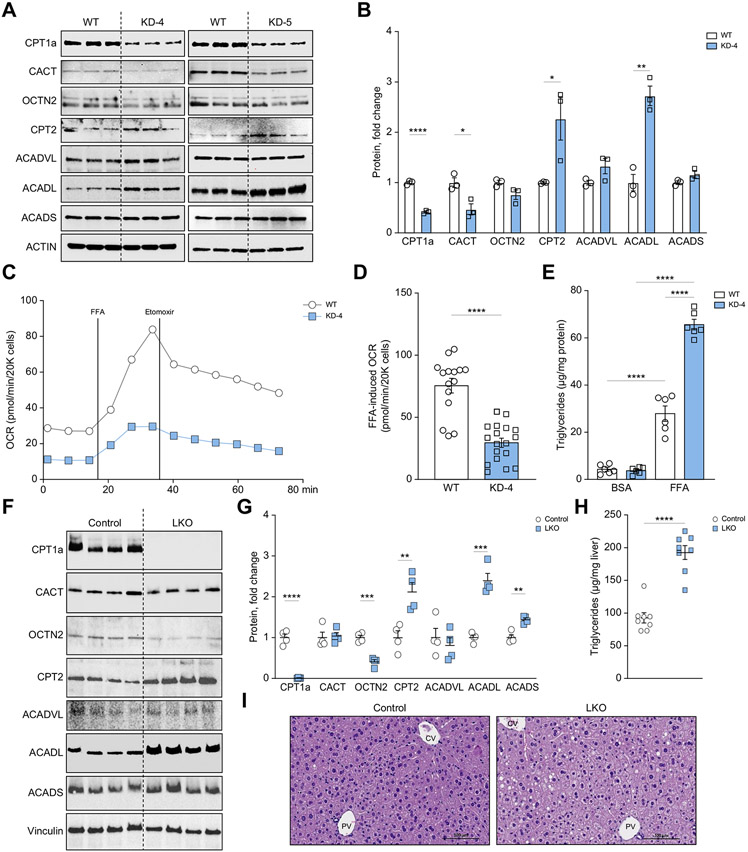
Fig. 5. CPT1a knockdown, in part, mirrors KHK–C overexpression in mouse hepatocytes.
(A-C) Carnitine shuttle/FAO protein levels (CPT1α, CACT, OCTN2, CPT2, ACADVL, ACADL, ACADS) were measured by western blot in WT and CPT1α knockdown clones 4 (KD-4) and 5 (KD-5) (A), and were further quantified by densitometry (B, KD-4 and S8C, KD-5) using actin as a loading control (n = 3). (C-D) Seahorse fatty acid oxidation assay (C) recording oxygen consumption rate (OCR) in WT and CPT1α KD-4 AML12 hepatocytes upon stimulation with free fatty acid (FFA) (D; n = 15-18 wells per group). (E) Triglycerides were quantified enzymatically from WT and KD-4 cells treated with BSA or 0.4 mM FFA for 24 h (n = 6). (F, G) Carnitine shuttle and FAO protein levels (CPT1α, CACT, OCTN2, CPT2, ACADVL, ACADL, ACADS) were measured by western blot (F) and were further quantified by densitometry (G) from CPT1a LKO and littermate control male mice. (H, I) Hepatic triglycerides were quantified (H) and livers were stained with H&E (I). 40x magnification and scale bar = 100 μm. Significance was determined using unpaired, Student’s t test. Significance is defined as *p<0.05; **p<0.01; ***p<0.001; ****p<0.0001. CV, central vein; PV, portal vein.

