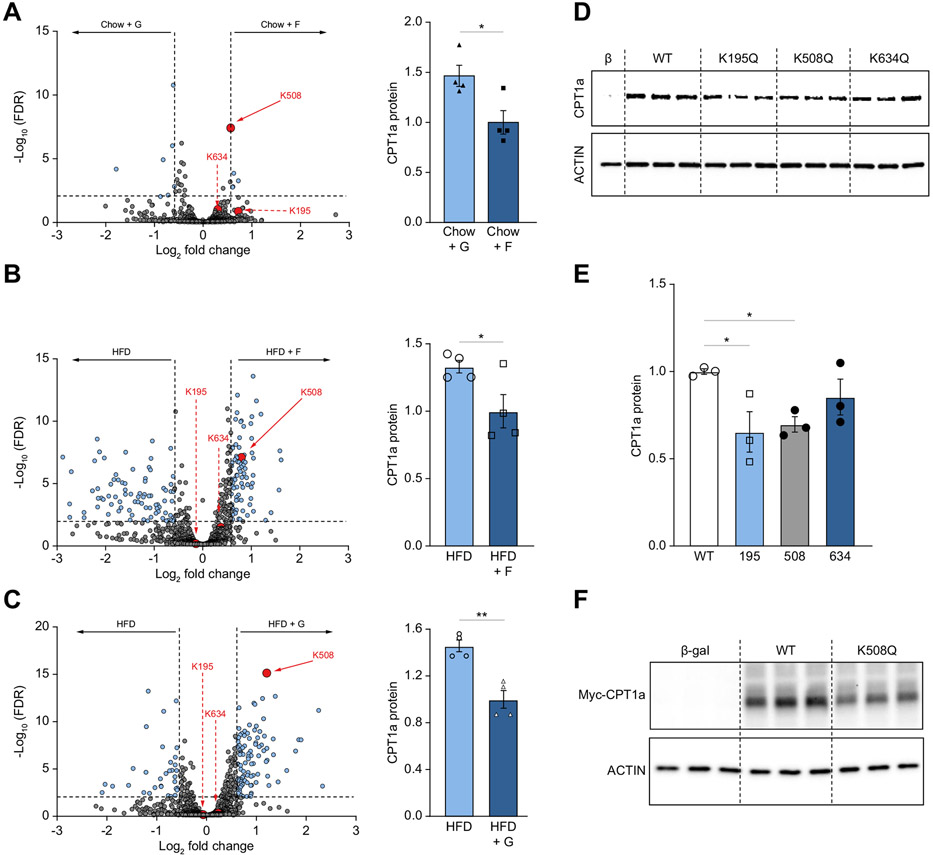
Fig. 6. Acetylation at lysine 508 decreases CPT1α protein levels.
(A-C) Volcano plots (A, B, C) highlighting all acetylation sites that are different between two dietary groups. CPT1α acetylation sites are highlighted in red. The horizontal black bar denotes the significance cut-off of FDR = 0.01. The vertical black bars denote a minimal threshold for effect size of 1.5 (Log2 fold-change = ±0.58). Quantification of total CPT1α protein levels (A, B, C; right) normalized to vinculin (loading control) across the same two groups. Protein levels of CPT1α were measured by western blot (D) in COS-7 cells transfected with plasmids encoding β-galactosidase control (β-gal), wild-type (WT) CPT1α, and mutant K195Q, K508Q, and K634Q CPT1α. (E) Densitometry quantification of the data in panel D. (F) Western blot for c-MYC tag in cells transfected with β-galactosidase control (Cont) plasmid, wild-type (WT) CPT1α c-MYC tagged plasmid and mutant CPT1α K508Q c-MYC tagged plasmid. Significance was determined by one-way ANOVA with Dunnet’s post hoc analysis comparing Cont to WT and mutant CPT1α proteins. Significance is defined as *p<0.05; **p<0.01; ****p<0.0001.

