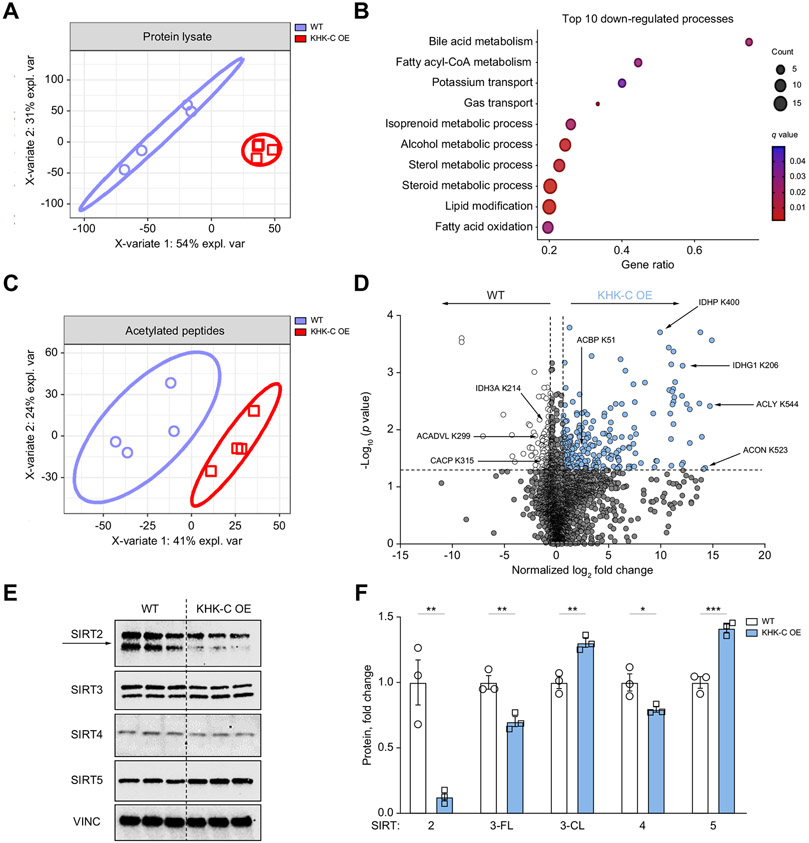
Fig. 7. KHK–C OE drives global protein acetylation in AML12 hepatocytes and alters sirtuin levels.
(A) Partial least squares-discriminant analysis comparing WT and KHK–C OE total protein levels. (B) Gene ontology analysis highlighting the top 10 most downregulated biological processes in KHK–C-overexpressing hepatocytes. (C) Partial least squares-discriminant analysis comparing acetylated peptides in WT and KHK–C-overexpressing cells. (D) Volcano plot analysis highlighting acetylated peptides that are increased (in red) or decreased (in purple) with KHK–C OE. The horizontal black bar denotes the significance cut-off of p value = 0.05. The vertical black bars denote a minimal threshold for effect size of 1.5 (Log2 normalized fold-change = ±0.58) (E, F) Sirtuin protein levels (SIRTS2-5) were measured by western blot in WT and KHK–C-overexpressing (E) cells and were quantified by densitometry using Vinculin (VINC) as a loading control. Sirt3 full-length (3-FL) and Sirt3 cleaved (3-CL) proteins (F; n = 3). Significance was determined using unpaired, Student’s t test, and is defined as *p<0.05; **p<0.01; ***p<0.001.

