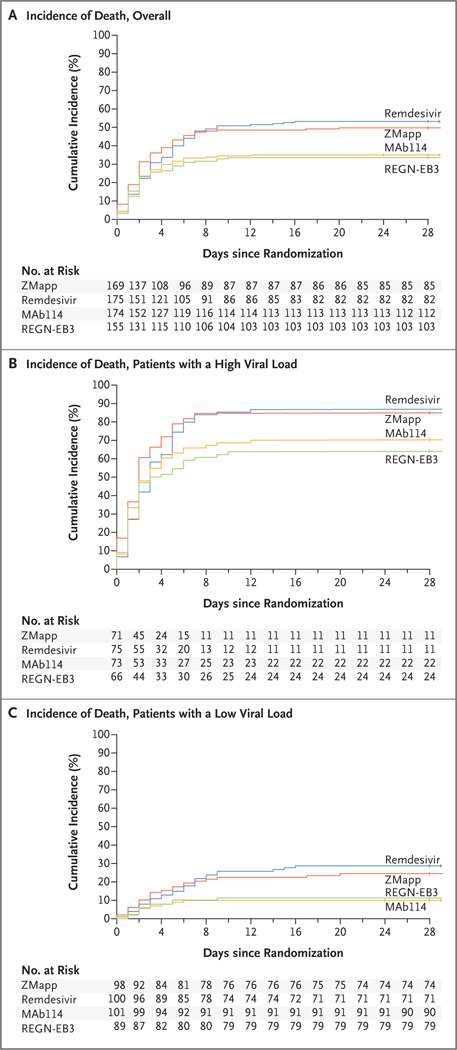
Figure 1. Cumulative Incidence of Death.
Shown are Kaplan–Meier estimates of the cumulative incidence of death. Panel A shows the estimates in the overall population, Panel B the estimates in patients who had a nucleoprotein cycle-threshold (Ct) value of 22 or less at baseline (corresponding to a high viral load), and Panel C the estimates in patients who had a Ct value of more than 22 at baseline (corresponding to a low viral load).

