
Figures 2A,2B,2C:
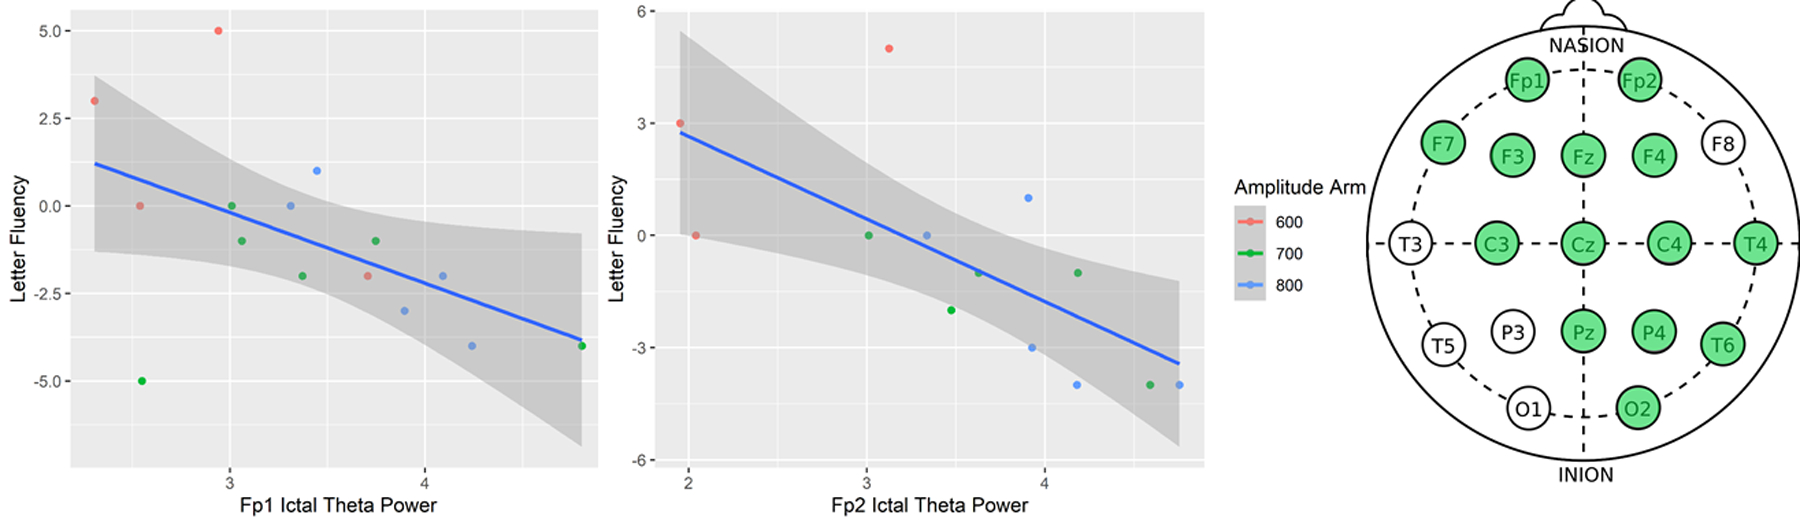
2A. Left. Letter Fluency vs. Ictal Theta Power in the Fp1 Channel 2B. Middle. Letter Fluency vs. Ictal Theta Power in the Fp2 Channel 2C. Right. Whole-brain exploratory analysis of cognitive performance and ictal theta power with standard 19-lead EEG map shown (CPz, P7, P8 and mastoid channels not shown). Green leads denote statistical significance (p<0.05).