Abstract
The advance of high resolution digital scans of pathology slides allowed development of computer based image analysis algorithms that may help pathologists in IHC stains quantification. While very promising, these methods require further refinement before they are implemented in routine clinical setting. Particularly critical is to evaluate algorithm performance in a setting similar to current clinical practice. In this article, we present a pilot study that evaluates the use of a computerized cell quantification method in the clinical estimation of CD3 positive (CD3+) T cells in follicular lymphoma (FL). Our goal is to demonstrate the degree to which computerized quantification is comparable to the practice of estimation by a panel of expert pathologists. The computerized quantification method uses entropy based histogram thresholding to separate brown (CD3+) and blue (CD3−) regions after a color space transformation. A panel of four board-certified hematopathologists evaluated a database of 20 FL images using two different reading methods: visual estimation and manual marking of each CD3+ cell in the images. These image data and the readings provided a reference standard and the range of variability among readers. Sensitivity and specificity measures of the computer’s segmentation of CD3+ and CD− T cell are recorded. For all four pathologists, mean sensitivity and specificity measures are 90.97 and 88.38%, respectively. The computerized quantification method agrees more with the manual cell marking as compared to the visual estimations. Statistical comparison between the computerized quantification method and the pathologist readings demonstrated good agreement with correlation coefficient values of 0.81 and 0.96 in terms of Lin’s concordance correlation and Spearman’s correlation coefficient, respectively. These values are higher than most of those calculated among the pathologists. In the future, the computerized quantification method may be used to investigate the relationship between the overall architectural pattern (i.e., interfollicular vs. follicular) and outcome measures (e.g., overall survival, and time to treatment).
Key terms: follicular lymphoma, CD3, cell quantification
Introduction
Follicular lymphoma (FL) is an indolent and incurable disease with a variable clinical course. Currently, available prognostic indices in FL rely on clinical parameters including age, stage, hemoglobin level, number of nodal areas, and serum lactate dehydrogenase, bone marrow involvement, serum beta-2 microglobulin and a large lymph node >6 cm, as reflected in the FL International Prognostic Score (FLIPI) (1–3) and FLIPI2 (4). The role of pathologic parameters in prognostication in FL has been limited to histologic grade, which is based on the relative proportion of centroblasts, or large cells, per high power field. However, accurate grading is challenging and the agreement among pathologists is variable. While prognostic indices such as FLIPI1/2 have been helpful for risk stratification, the identification of more reliable tissue-based prognosticators is critical for predicting the clinical course of individual patients. Clinical heterogeneity of FL is strongly associated with composition of nonmalignant cells forming tumor microenvironment (1). This seminal observation was further supported by several pathological observations where the number of T lymphocytes around and within malignant follicles demonstrated strong correlation with clinical outcomes (2–5).
The non-neoplastic tumor environment (e.g., helper and cytotoxic T cell subsets, macrophages and follicular dendritic cells) plays an important role in FL pathogenesis, and appears to impact clinical behavior (4). Many studies have been performed to determine the clinical significance of the non-malignant cell populations using markers such as CD10, Bcl-6, CXCR5, FoxP3, PD1, CD25, and CD8, among others, to evaluate biologic and prognostic relevance of different T cell subsets (5–8). However, the results of these studies were frequently contradictory with different cell subsets correlating with good prognosis in some studies and with poor or indifferent prognosis in others (5–7,9,10). This lack of correlation among studies may be related to many factors, including the inherent subjectivity of manual scoring of immunohistochemical stains (11). Accurate quantification of microenvironment constituents is of critical importance for the effective assessment of their prognostic significance. However, there are several challenges to manual counting. At the basic level the quantitative interpretation of IHC stained slide by human reader represents classical non-symbolic numerical challenge. It relies on at least two different nonsymbolic numerical systems. For small numerosities such as (12–15) humans use “subtilizing” where positive events are individually tracked (Object Tracking System-OTS) and accurately estimated for their number without actual counting. In contrast, for large numerosities quantification humans use approximate system of numerical representation based on analog magnitudes commonly referred to as approximate number system (ANS) (12,13). Both of these systems are interchangeably used by pathologists in daily clinical practice to generate semi quantitative IHC interpretations. These manual methods are tedious and time consuming and for practical reasons cannot be applied to large number of specimens in reproducible fashion. Moreover, the quality of manual “counting” is influenced by reader attention, patience and concentration (14). Predictably, manual method suffers from poor reproducibility at both intra-observer and inter-observer levels (15,16).
The advance of high resolution digital scans of pathology slides allowed development of computer based image analysis algorithms that help human readers in IHC stain quantification (14–21). While very promising, these methods require further refinement before they are implemented in routine clinical setting. Particularly critical is to evaluate algorithm performance in a setting similar to current clinical practice. However, such studies are difficult to perform due to lack of universally available set of slides/digital images with solid “ground truth” data.
The majority of FL cases are diagnosed in community hospital setting outside of specialized academic centers by pathologist with variable level of training. Currently used manual methods and “threshold based” computer methods used for T cell enumeration generate at best semi quantitative data that is of limited quality in term of accuracy and reproducibility. Improvement of methods for accurate and reproducible enumeration of T cells is therefore mandatory to afford true “in the field” validation of T cell enumeration in FL as important clinical predictor. Such validation requires performance of T cell enumeration in a large number of FL cases by pathologist with broad spectrum of expertise including those who diagnose FL outside of large academic centers. This need prompted us to create a computerized method that will help pathologists with reproducible enumeration of IHC stained CD3 T cells in FL. This method, when developed and validated, will become available for free on the web and will enable pathologists to objectively and accurately enumerate T cells in clinical FL cases. Moreover, this method will be also useful for accurate quantification of other cell types that can be identified in tissue sections by IHC stains with membranous staining pattern.
In our future studies will look into whether or not the architectural pattern has prognostic significance. Before we can investigate the prognostic value of architectural patterns for CD3 staining, a method to automatically quantify the CD3+ T cells must be established in order to analyze images at a bigger scale. The resulting output of the computerized quantification can then be correlated to pathologists’ estimates and patient outcomes. This larger study will take several years to complete; thus, in this manuscript we are primarily focusing on the first stage of the process. Once we have established agreement with the pathologists, we will explore the potential of correlating pathological analysis with patient outcome. Correlation with patient outcome may enable us to discover the true number of cancer grades in follicular lymphoma, that is, development of new grading system for follicular lymphoma. As part of the future studies, we will also explore the relationship of grading based on HPF images with those on whole slide images. Similar experimental setup can be adapted for different IHC stains to better characterize Follicular Lymphoma.
In this article, we present a “proof of principle” pilot study to evaluate the utility of a computerized cell quantification method in the clinical estimation of CD3 positive (CD3+) T cells in FL. Specifically, we evaluate the correlation of computer-based quantification with both manual pathologist estimation and a “reference standard” established by a panel of board-certified hematopathologists.
Methodology
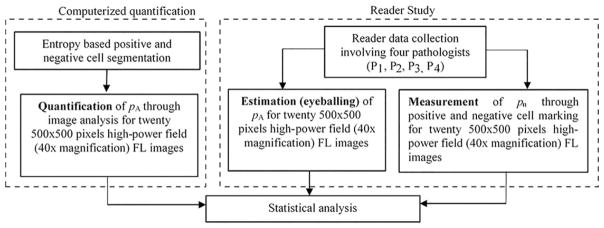
Comparisons between quantifications by pathologists and those by an image analysis algorithm require an experimentation strategy. The pathologists’ quantification estimation was captured in two ways: (1) visual estimation (also known as the practice of “eyeballing”) and (2) digitally marking each positive and negative cell in the images. For the same set of images, we ran the computer analysis algorithm and then compared the results of the computer algorithm with those of the pathologists in a statistical framework. In Dataset section we describe the dataset and in Experimentation Strategy section the experimentation strategy. From a clinical perspective, this is the first time that quantification variations among pathologists are analyzed when grading CD3+ T cell stained images in FL. From an image analysis perspective, the methodology used in this study presents a novel way to combine different color spaces for CD3+ staining analysis, while our previous work on focused on Ki-67 stain quantification (21). Initial tests are independently conducted in Ki-67 stained image datasets. A robustness evaluation toward staining levels has been conducted in a previous work on Cleaved Caspase 3 (CC3) staining (22). The work presented in this article is the first time it is utilized for quantification of CD3+ T cells.
Dataset
In this study, CD3 immunohistochemical staining (IHC) was used revealing the surface of all mature T-cells, well suited for pre-segmenting follicles even at low resolution. All CD3 antigen immunohistochemical stains were performed in clinical (CAP and CLIA approved) immunohistochemistry laboratory at the Ohio State University Medical Center (OSUMC) using automated Leica Bond staining system (Leica BioSystems, Buffalo Grove, IL) according to the approved protocol. In brief, 3-μm-thick sections of tissue were placed on positively charged glass slides (Fisher Scientific) along with appropriate positive and negative controls. Slides were baked at 60°C for 60 min and then placed into instrument holders. Antigen retrieval using ER2 reagent (Leica BioSystems, Buffalo Grove, IL part # 9640) and staining were performed using protocol with Bond Polymer Refine Detection reagent (Leica BioSystems, Buffalo Grove, IL, Part #DS9800). Polyclonal rabbit anti-human CD3 antibody was used from Dako A0452 at 1:400 dilution. Slides were counterstained with hematoxylin on Bond instrument. Following completion of staining, slides were dehydrated by serial immersion in 70%, 95% x2, 100%x2 alcohol and Xylene and cover slipped using Tissue TEK Glass 6419 mounting media.
The CD3 stained tissues were digitized using an Aperio ScanScope XT (Aperio, San Diego, CA) at 40×, magnification. At 40×, the pixel size of the images was 0.25 μm/pixel and a high power field (HPF) represents 0.18 mm2. For the experiments, two sets of 20 images were cropped at sizes of 500 × 500 pixels. The images were cropped from different regions in the slides with no overlap among them. The cropped regions were chosen in such a way to represent the diversity of CD3 Positive (CD3+) T-cells in any given region of a CD3 stained tissue. Figure 1 shows some examples of the images with varying degrees of CD3+ cells.
Figure 1.
Examples of the 500 × 500 pixel CD3 IHC stained images used in the experiments. There were 20 such images. The brown pixels indicate CD3+ T cells while the blue pixels are the CD3− T cells. [Color figure can be viewed at wileyonlinelibrary.com]
Experimentation Strategy
The experimentation strategy was divided into three components: computerized quantification (Computerized Quantification of CD3+ T Cells section), a reader study (Reader study section) and statistical data analysis (Statistical Analysis Methods section) as illustrated in Figure 2.
Figure 2.
Flowchart illustrating the experimentation strategy. pA represents the percentage area covered by positive cells among all cells while pn indicates the percentage of positive cells among total number of cells in any given image. For detail definitions of pA and pn refer to Eqs. (3) and (4), respectively. P1, P2, P3, and P4 represent pathologists 1, 2, 3, and 4, respectively.
Computerized quantification of CD3+ T cells
Automated detection of the immunostained nuclei is a well-studied problem in image analysis (20,22,23). Because of the circular appearance of the immunostained nuclei, a wide number of mathematical frameworks have been developed (24–26). However, there are only a limited number of studies which address the quantification of cells stained with cytoplasmic immunostain (27). The anisotropic appearance of the cytoplasm along with cell clumping makes it challenging to automate the cell detection process. Even expert pathologists find it challenging to quantify cells with cytoplasmic staining. So, this article reports the initial findings of a larger study designed to automatically quantify the cytoplasmic stained (CD3+) cells.
Identification of CD3+ immunostaining in the digital slides is a color image analysis problem: potentially positive cells appear in hues of brown while negative cells appear in hues of blue. In this study, the objective of detecting and quantifying positively stained cells is equivalent to differentiating brown-stained cells from the blue-stained cells and the background. Although computer-based analysis of CD3+ stains appears deceptively as a simple visual classification task, it is actually much harder because there are a variety of different shades of brown within a single image due to staining variations between and within the slides. Given these challenging circumstances, the image segmentation process must produce robust, reliable and consistent results.
Towards achieving the aim of the project, the crucial step is detecting positive stains from CD3 stained tissue slide images. This could be divided into the process of (1) segmenting varying shades of brown regions and (2) further differentiating these from the negative (blue) cells and background (mostly white) (21).
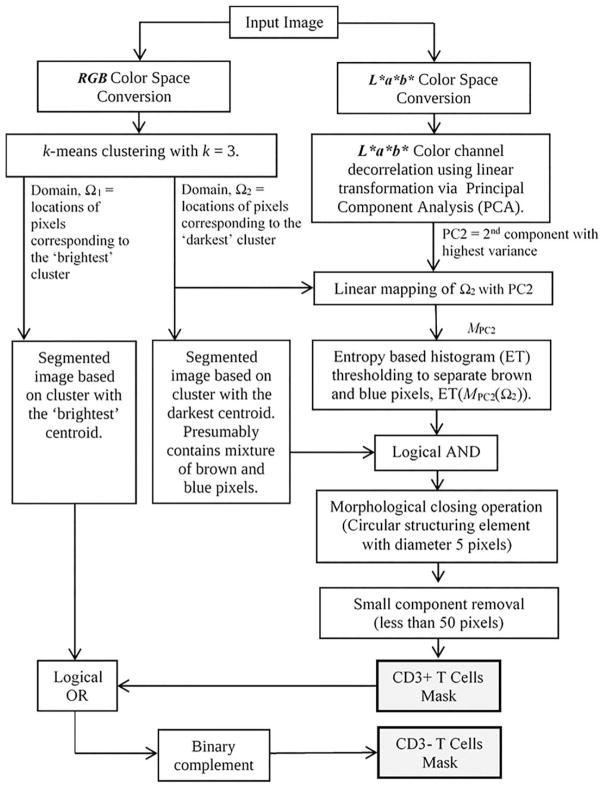
The image analysis methodology used in this study was based on our previous work on the quantification of Ki-67 positive cells in the measurement of cell proliferation (21). The method exploits the intrinsic properties of the L*a*b* or CIELab color space. Figure 3 shows the flowchart describing the method to segment the CD3+ and CD3− T cells from digitized CD3-stained tissues.
Figure 3.
Flowchart of the CD3+ and CD3− T cells segmentation method.
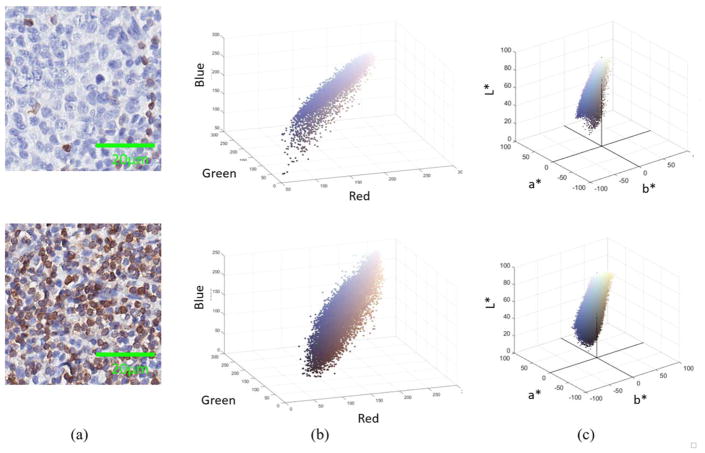
An image produced through the CD3 staining consists of three major hue classes namely brown, blue and white. Figure 4 shows two sample CD3 stained images and their three-dimensional (3D) color scatter plot in Red-Green-Blue and CIELab color spaces. The two selected sample images represent two extreme cases of CD3+ stain density (sparsely dense and highly dense).
Figure 4.
Scatter plots of two sample CD3+ stained images (a) in (b) RGB and (c) L*a*b* color formats. [Color figure can be viewed at wileyonlinelibrary.com]
The three classes represent the existing components in the CD3 stained images, the CD3+ T-cells (brown), the CD3− T-cells (blue) and the background (white). Assuming that an image will always consist of those three components, a clustering method is used to group pixels using these three components in a 3D space. For a Red-Green-Blue (RGB) image I formed by N pixels (p1, p2,…,pN), where each pixel is an n-tuple (n =3), k-means clustering partitions the N pixels into three classes c ={c1, c2, c3}. The following optimization function was used to finalize the cluster groupings:
| (1) |
where μi represents the centroid of the ith cluster. To determine the cluster centroid that corresponds to the brown pixels, we utilise the fact that light will be relatively more absorbed in the brown regions than any other areas. The correspondence between the centroid and the brown class can be represented by the formulation:
| (2) |
Even if we assume that the correspondence is accurate, k-means clustering often groups certain blue and brown areas in the same cluster due to a large variability in shades of blue and brown pixels. Thus, the cluster with the lowest centroid magnitude value contains a mixture of brown and blue pixels. An additional step is needed to segment the brown and the blue in this particular cluster. In our previous work (21), we addressed this misclassification using a linear transformation in the CIE-Lab color space, which translates this oversegmentation problem into a thresholding problem. The L*a*b* or CIELab adopted from the Commission Internationale d’Eclairage (CIE) in 1976 is an international standard for color measurements. L* is the luminance or lightness component, which ranges from 0 to 100 representing black to white. Parameters a* (from magenta hue to red hue) and b* (from blue hue to yellow hue) are the two chromatic components (28).
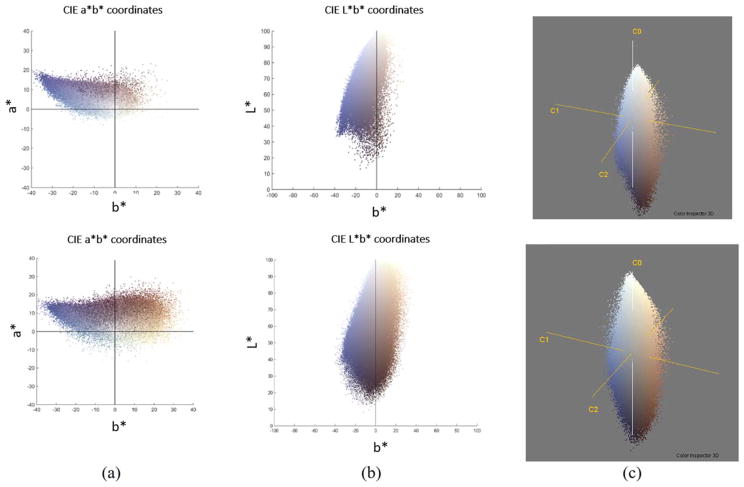
Relating the CIELab color space to the problem at-hand, the focus of the algorithm was to segment the image into three classes (hues of brown, blue and white). In the presence of shades of blue and brown pixels, the L* channel in the L*a*b* color space correlates quite strongly with the b* channel of the image. It can also be observed that, the regions corresponding to the brown cells in the b* channel have slightly higher intensity values as compared to those of blue cells and the background. This corresponds to the intrinsic nature of the L*a*b* color space where the blue hue in the b* channel is represented by negative values. However, the difference among the average intensity values corresponding to blue, white and brown regions is so marginal that the blue and brown pixels are indistinguishable in the probability mass function of the b* channel with Figure 5a illustrating the situation. In the L* channel, the area corresponding to the brown pixels has lower intensity values than those of blue regions. However, there is no single threshold to properly separate the classes from the probability mass function of the L* channel as shown in Figure 5b.
Figure 5.
Based on the two sample images shown in Figure 4(a), the top and bottom figures in (a) show the corresponding scatter plot of a* vs. b* color channel while the top and bottom figures in (b) show plot of L* vs. b* channels. (c) The Principal Component Analysis (PCA) projections for the two sample images in Figure 4(a). PCA rotates the current axis so that the eigenvector corresponding to the highest eigenvalue points in the direction of maximum information content in an image. [Color figure can be viewed at wileyonlinelibrary.com]
From the discussion about CD3 stained images, it can be concluded that L* and b* contains similar information except for brown pixels. So, from an information theory perspective b* can be considered as redundant in the presence of the L* channel. As the brown class changes its intensity values from being the highest in b* to the lowest in the L* channel, we can conclude that the brown class corresponds to the source of information (entropy) between the L* and b* channels. Visual inspection reveals that information content in a* can be considered as a subset of the b* channel. Once again from information theory perspective a* can be considered as redundant in the presence of the b* channel. Although the L*a*b* color space provides perceptual uniformity in comparison to other color spaces, its color (i.e., a*, b*) and luminance (i.e., L*) decompositions do not correspond to the information based visual decomposition of a monoclonal antibody stained image (i.e., meaningful segmentation into biologically relevant components).
To achieve the information based visual decomposition of an image; it is often desirable to decorrelate the individual channels by virtue of some transformation. Principal component analysis (PCA) is one of the most widely used linear transformations where the normalized eigenvectors serve as the new orthogonal coordinate system (17). PCA rotates the current axis so that the eigenvector corresponding to the highest eigenvalue points in the direction of maximum information content in an image. In our case, the application of PCA will transform the basis vectors of the L*a*b* color space to a set of new orthogonal basis vectors as shown in Figure 5c.
The projection of the L*a*b* image onto these new basis vectors will provide much more meaningful insight into the biological information present in an image. A PCA linear transformation of the data is expected to project L* channel in the original image onto the first channel corresponding to the largest eigenvalue since the L* channel is much richer in terms of information content compared to the* and b* channels. The second channel corresponding to the second largest eigenvalue in the projected image highlights the regions corresponding to the brown class since this class was the source of information between L* and b* channels. The third channel generally contains noise and may be ignored.
To segment the brown and blue pixels in the brown class, further pixel separation needs to be performed. To do this, the pixels belonging to the class obtained through k-means clustering in the second channel of the projected image are subjected to entropy based histogram thresholding (29). The threshold value is calculated in such a way that the sum of entropies of the probability distribution is maximized. A binarization process using the calculated threshold results in a segmented image which is then post-processed by morphological operations to fill small holes and to remove isolated pixels.
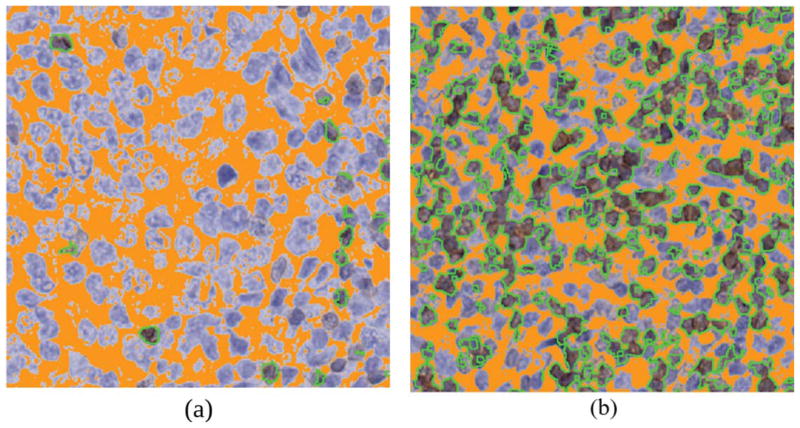
The postprocessing steps involved morphological opening operation using circular-shaped structuring element with a diameter of 5 pixels followed by the removal of connected components smaller than 50 pixels. The tuneable parameters are set based on several assumptions which are acquired from independent set of training images not used in this study. Firstly we assume that the segmentation of CD3+ T cells results in cell masks with holes and imperfect boundaries. Secondly, we made the assumption that noise or artefact that are misclassified or deemed insignificant to the analysis is formed by <50 connected pixels. CD3+ T cell (brown hue) regions manifested as brown hue can be represented by number of white pixels in the post-processed image. Figure 6 shows some examples of images with the detected CD3+ T cells represented as brown hue.
Figure 6.
Two sample output images corresponding to the sample images in Figure 4(a). The brown regions detected by the proposed method are outlined with green borders and the background highlighted in orange. [Color figure can be viewed at wileyonlinelibrary.com]
Reader study
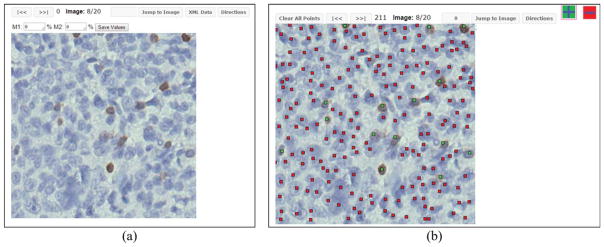
Our reader study involved four board-certified hemapathologists; two from the Department of Pathology at The Ohio State University (Columbus, Ohio) and two from the Department of Pathology, Massachusetts General Hospital (Boston, Massachusetts). CellMarker, a cell marking and annotation system designed and developed at the Clinical Image Analysis Laboratory, Department of Biomedical Informatics, The Ohio State University was used to gather input from the hemapathologists (see Fig. 7). Each reader in the study was trained on how to use the system through teleconferences attended by all the pathologists.
Figure 7.
Sample snapshots of the cell marking interface presented to readers for module 1 and module 2 of the reader study. (a) The interface where percentage estimates are entered through “eye balling” in module 1. This sample does not show the actual input from a reader. (b) Positive and negative cells are marked with different color markers in module 2. This sample does not show the actual input from a reader. [Color figure can be viewed at wileyonlinelibrary.com]
The readers input their data via two different modules (see Fig. 7). The first module (Fig. 7a) asked the pathologists to estimate the percentage of CD3+ cells among all cells in the presented image. We denote this measurement as pA shown in Eq. (3).
| (3) |
The readers browsed through the twenty 500 × 500 pixel images and entered their estimate of pA for each image (so-called “eyeballing” estimate). The images were randomly arranged and presented to the pathologists in 40× magnification.
The second module gathered reader input in a more precise manner in which all cells were marked with labelled markers to allow CD3 positive (CD3+) cells to be differentiated from the CD3 negative (CD3−) cells (see Fig. 7b as an example). The pathologists were again presented with all the twenty images in a random sequence and required to digitally mark the cells with a click as close as possible to the center of the nuclei (our evaluation software has some margin of error to account for small variations among different pathologists who aim to mark the same cell with small differences in their marking). Thus, this module collected information on the coordinate location of the perceived center of selected cells and their class (i.e., CD3+ or CD3−). This information was used to calculate the percentage of brown cells:
| (4) |
In practice, the pn measure gives us a more precise indication of the amount of CD3+ T cells in a given image since they are represented by actual cell counts rather than an estimate through “eyeballing.” However, manual cell counting is a very time consuming and cumbersome process compared to “eyeballing” and is not practical for a large number of samples and/or for whole-slide images.
Statistical analysis methods
In our study, we compared three different approaches to CD3+ T-cell quantification (see): (1) computerized cell quantification based on pixel area coverage; (2) estimation of cell population percentage based on “eyeballing;” and (3) measurement of cell population percentage through manual cell marking. It is highly challenging to detect individual cells in CD3 stained images because the stains do not encompass the whole cell. Moreover, the anisotropic appearance of the cytoplasmic stained region, the unpredictable nature at which cells are distributed, the presence of cell clumps also add to the difficulty of detecting individual CD3+ cells. Therefore, we chose a more flexible and adaptive methodology based on color deconvolution as explained in Computerized Quantification of CD3+ T Cells section.
The purpose of our statistical analysis was to compare the performance of the computer analysis to that of hematopathologists in determining the percent area of CD3+ (brown) cells relative to the area covered by all cells in an image [i.e., a comparison of pA determination in Eq. (1)]. The “reference standard” in our analysis was the average percentage of CD3+ cells across pathologists determined via the cell count (i.e., the average pn). Our assumptions in using this reference standard were that the average areas of brown and blue cells are similar, so that a ratio of counts is representative of a ratio of areas, and that average pn can be a more reliable reference standard because cell counting is a quantitative process. The computer percent area estimate was compared to the average pn, while each pathologist’s estimate of pA was compared to the average pn omitting the pathologist in question to avoid self-consistency bias from assessing pn and pA by the same pathologist. Bias was determined using the average difference between the computer’s (or pathologist’s) determination and the reference standard and Bland-Altman plots (30) were used to determine if bias varied with percentage of CD3+ cells. Three types of agreement measures were obtained: the Pearson correlation was used to quantify the linear correlation, Lin’s Concordance Correlation (31) was used to quantify the reproducibility in pA quantification as compared to the reference standard, and Spearman’s Rank Correlation was used to quantify the agreement with the reference standard in the ranking of images from least to greatest percentage of CD3+ cells. Statistical analysis was performed using Intercooled Stata Version 11.2 (StataCorp LP, College Station, TX).
Results
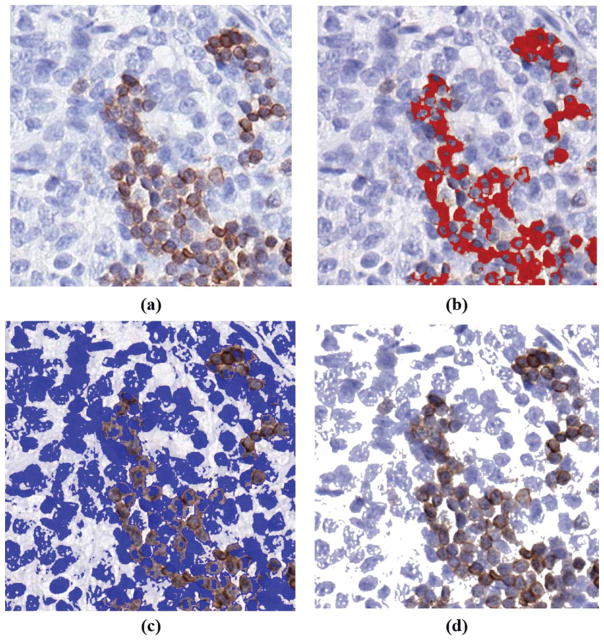
A study on the accuracy of the image segmentation through comparison with the manual CD3+ and CD3− T cell marking output for all four pathologists was conducted. The segmented images were first compared with the cell marking output from the four pathologists to evaluate the reader-based agreement and variability. Because the coordinates of all CD3+ cells (hues of brown) and CD3− cells (hues of blue) corresponding to all four pathologists are known, their exact locations can be compared with the segmented images. Figure 8 demonstrates the outcome of the segmentation process showing the CD3+ T cell regions, CD3− T cell regions and the background regions.
Figure 8.
An example showing (a) a sample image decomposed into (b) CD3+ T cell regions detected by the highlighted in red, (c) CD3− T cell regions highlighted in blue and (d) background regions in white. [Color figure can be viewed at wileyonlinelibrary.com]
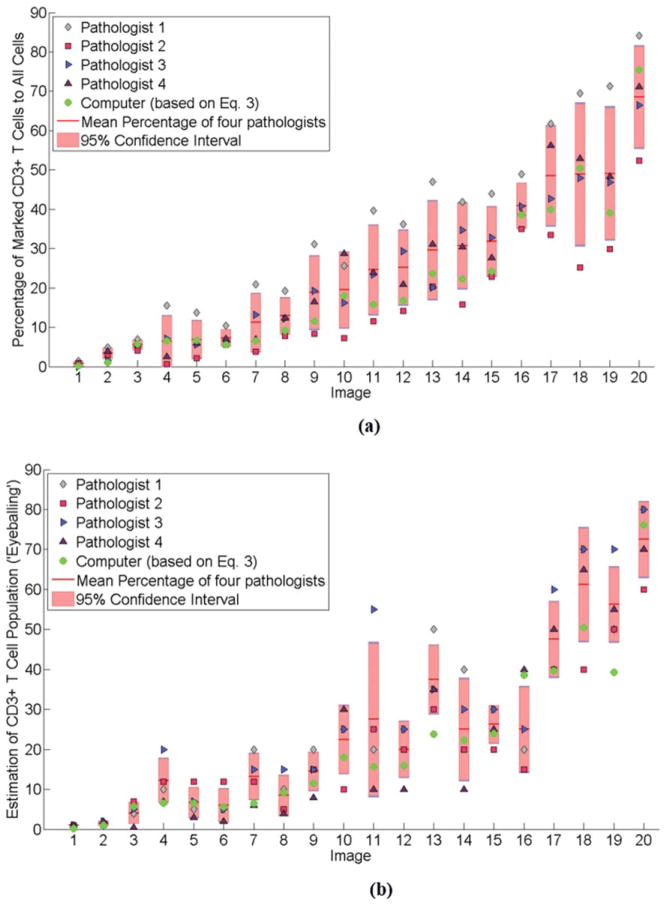
Using each pathologist’s markings as reference standards, the sensitivity and specificity measures were calculated for all four pathologists. Sensitivity here was defined as the proportion of CD3+ cells which were correctly segmented as such while specificity was defined as the proportion of CD3− cells which were detected as being CD3−. As can be seen in Table 1, the sensitivity of the CD3+/CD3− segmentation ranges between 75.73% and 99.52% with P1 showing the highest sensitivity while P2 with the lowest sensitivity. The specificity analysis recorded values between 79.84 and 95.79% with P1 recording the least specificity and P2 with the highest specificity. The mean sensitivity measures for all four pathologists reveal a slightly higher figure compared to specificity, although not particular dominant. The mean sensitivity and mean specificity was 90.97 and 88.38%, respectively. Figure 9a shows comparisons between the computerized quantification [refer to Eq. (3)] with the pathologists’ measurements of pn through positive and negative cell markings. Figure 9b compared the computerized quantification outputs with the results of “eyeballing” by all four pathologists.
Table 1.
An evaluation of (a) sensitivity and (b) specificity of CD3+ and CD3− cell segmentation for all four pathologists
| PATHOLOGIST | NUMBER OF CD3+ CELLS IN BROWN SEGMENTED REGIONS | NUMBER OF CD3+ CELLS IN BLUE SEGMENTED REGIONS | SENSITIVITY | PATHOLOGIST | NUMBER OF CD3− CELLS IN BROWN SEGMENTED REGIONS | NUMBER OF CD3− CELLS IN BLUE SEGMENTED REGIONS | SPECIFICITY |
|---|---|---|---|---|---|---|---|
| (a) | (b) | ||||||
| P1 | 827 | 4 | 99.52% | P1 | 514 | 2036 | 79.84% |
| P2 | 649 | 208 | 75.73% | P2 | 134 | 3050 | 95.79% |
| P3 | 778 | 49 | 94.07% | P3 | 344 | 2677 | 88.61% |
| P4 | 766 | 44 | 94.57% | P4 | 293 | 2442 | 89.29% |
| Mean | 90.97% | Mean | 88.38% |
P1, P2, P3, and P4 represent the four pathologists.
Figure 9.
Results of computerized CD3+ T cell quantification [based on Eq. (3)] shown against the four pathologists’ quantification estimates. The computerized quantification consistently results within 95% confidence interval of the marked CD3+ T cell population of the four pathologists as shown in (a). It is also observed that the four pathologists exhibit a consistent and predictable pattern in marking CD3+ and CD3− T cells. A different pattern is seen in (b) which shows results of CD3+ T cell population estimation through “eyeballing.” For visual clarity, both data in (a) and (b) are sorted in ascending order to the mean percentage of CD3+ T cell population in (a). [Color figure can be viewed at wileyonlinelibrary.com.]
An analysis of bias, concordance (agreement) and ranking of images was also conducted. This is done for estimation of CD3+ T cells (“eyeballing”) and computerized quantification of CD3+ T cells using the manual CD3+ T cell marking output as the “reference standard.” Table 2 and Figure 10 summarize the findings in this respect.
Table 2.
Performance of pathologists and the computer in determining CD3+ T cell coverage
| PATHOLOGIST 1 | PATHOLOGIST 2 | PATHOLOGIST 3 | PATHOLOGIST 4 | COMPUTER | |
|---|---|---|---|---|---|
| Mean pA ± SD | 26.3 ± 22.6 | 20.4 ± 16.1 | 29.5 ± 24.6 | 21.7 ± 23.0 | 19.0 ± 13.5 |
| Bias ± SD | 2.4 ± 12.3 | −10.0 ± 9.6 | 1.9 ± 11.8 | −5.6 ± 11.3 | −8.3 ± 5.6 |
| CCC (95% C.I.) | 0.79 (0.61, 0.89) | 0.73 (0.50, 0.86) | 0.84 (0.70, 0.92) | 0.81 (0.64, 0.91) | 0.81 (0.67, 0.90) |
| Rank Corr. (95% C.I.) | 0.90 (0.77, 0.96) | 0.85 (0.65, 0.94) | 0.96 (0.89, 0.98) | 0.99 (0.97, 1.00) | 0.96 (0.91, 0.99) |
| Pearson Corr. (95% C.I.) | 0.86 (0.67, 0.94) | 0.86 (0.68, 0.94) | 0.90 (0.76, 0.96) | 0.89 (0.73, 0.96) | 0.97 (0.91, 0.99) |
Figure 10.
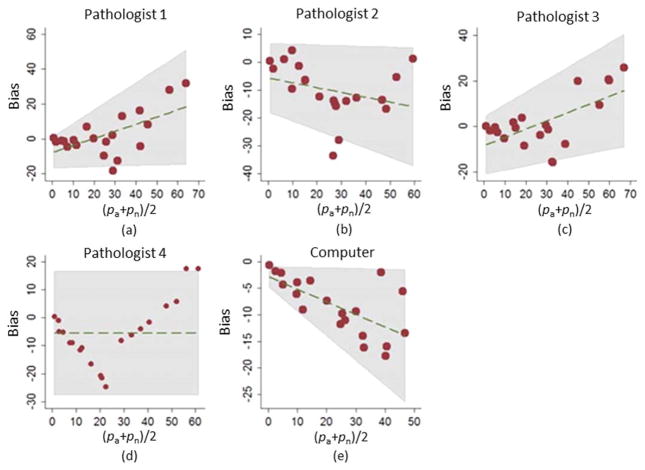
The Bland-Altman plots illustrating the relationships between the “eyeballing” CD3+ T cells estimates and the average cell marking measurements for all four pathologists shown in (a) through (d). The computerized quantification is compared to the average cell marking measurement and shown in (e). The plots represent bias versus (pA +pn)/2. [Color figure can be viewed at wileyonlinelibrary.com]
Discussion
A comparison was made between the computerized CD3+ T cell quantification [refer to Eq. (3)] and the percentage CD3+ T cell measurements [refer to Eq. (4)] for all four pathologists. Plotting the values for all 20 images as shown in Figure 9a, revealed that the computer algorithm consistently stayed within 95% confidence interval for all images when compared against the measurements by all four pathologists. Another interesting observation is the patterns of consistency shown by the four pathologists in performing cell marking. Though this article does not intend to discuss the “correctness” of the cell marking output, it is worth considering the stark contrast this result exhibits compared to the quantification done by “eyeballing” as shown in Figure 9b. Figure 9b also compared the computerized quantification with the results of CD3+ T cell population estimation through “eyeballing.” It can be clearly observed that the computerized quantifications for all the 20 images struggled to be within the 95% confidence interval where four quantification values strayed outside the interval. From the comparisons made between Figure 9a and Figure 9b we can conclude that the computerized quantification is more in agreement (within 95% confidence interval) with the “reference standard” compared to the “eyeballing” results for the four pathologists in the study.
Table 2 shows the results of the bias, concordance (agreement) and ranking analysis. The computer calculations of pA tended to be smaller than the pathologists’ estimates and varied less from image to image. However, the computer’s calculations were more biased than three out of the four pathologists. The average pA for the computer was 19.0, while the average pn for the four readers (reference standard used in finding computer bias) was 27.3. As seen in Figure 10, the bias varied linearly with percentage of CD3+ cells; a negative linear relationship was observed for the computer while the pathologists exhibited negative linear (Pathologist 2), positive linear (Pathologists 1 and 3), and nonlinear (Pathologists 4) relationships. Table 2 also shows that the computer’s concordance with our reference standard was comparable to that of the pathologists both in terms of the percentage of CD3+ cells (quantified by the CCC) and ranking of images (quantified by the Spearman’s rank correlation). Pearson correlation between the computer and the reference standard was larger than those for the pathologists.
Conclusions
An exploratory study on automatic quantification of CD3+ T cells in FL cases is presented. The method segments and quantifies CD3+ T cells based on color properties and comparing the results with clinical practice where pathologists either estimate (“eyeballing”) the percentages of positively stained cells, or in some instances manually count the cells while separating positive and negative cells. This study is part of a larger project whose overarching goal is to quantify CD3+ T cells in a FL image sample and determine its overall architectural pattern (i.e., interfollicular vs. follicular) and investigate the relationship between the architectural pattern and outcome measures (e.g., overall survival, and time to treatment) with the hypothesis that architectural pattern will have prognostic significance and this relationship can emerge from the quantification of positive cells on the FL images. We compared a computerized quantification method that we developed to the results from a panel of four expert pathologists.
From the analysis, it is evident that the computerized quantification showed good agreement with the “eyeballing” input of a panel of expert pathologists. However, it is also clear from the results that the computer quantification agrees more with the CD3+ T cell population estimates based on individual cell marking which is our “reference standard,” compared to the results of “eyeballing.” Results also show that cell quantification consistency is more prevalent in individual cell marking compared to “eyeballing.” In terms of agreement, the computer’s concordance with the reference standard was comparable to that of the pathologists both in terms of the percentage of CD3+ T cells and ranking of images. The study reveals that the performance of the computerized quantification method is similar to the “eyeballing” method typically used by pathologists comparing both of them to the reference standard. We hope that this would up potential future studies which may look into images of different sizes, images with cell distribution variations and images with different staining intensities which were not covered in this study. The results also demonstrated the need for further studies on inter-reader and intra-reader variability especially in the practice of estimating cell population. It could be useful to reinforce standardization of visual analysis in clinical assessment and revealing unknown factors influencing cell population estimation judgments. Looking at the computerized quantification, from a mathematical viewpoint, the method is useful as long as both CD3+ and CD3− stained cells have similar sizes. In fact, we exploited this property to avoid the algorithmically as well as computationally complex problem of detecting individual cytoplasmic stained cells. However, the method will fail to provide the correct approximation if CD3+ and CD3− cells have considerably different sizes. In the future, we are hoping to improve the method and consider its implementation for other nuclear stains and in larger datasets.
Acknowledgments
The content is solely the responsibility of the authors and does not necessarily represent the official views of the National Cancer Institute, the National Institute of Allergy and Infectious Diseases, or the National Institutes of Health. Metin Gurcan and Gerard Lozanski are senior authors.
Grant sponsor: National Cancer Institute, Grant numbers: R01CA134451; and U24CA199374
Grant sponsor: National Institute of Allergy and Infectious Diseases, Grant number: R56 AI111823
Literature Cited
- 1.Dave SS, Wright G, Tan B, Rosenwald A, Gascoyne RD, Chan WC, Fisher RI, Braziel RM, Rimsza LM, Grogan TM. Prediction of survival in follicular lymphoma based on molecular features of tumor infiltrating immune cells. N Engl J Med. 2004;351:2159–2169. doi: 10.1056/NEJMoa041869. [DOI] [PubMed] [Google Scholar]
- 2.Lee AM, Clear AJ, Calaminici M, Davies AJ, Jordan S, MacDougall F, Matthews J, Norton AJ, Gribben JG, Lister TA. Number of CD4+ cells and location of forkhead box protein P3-positive cells in diagnostic follicular lymphoma tissue microarrays correlates with outcome. J Clin Oncol. 2006;24:5052–5059. doi: 10.1200/JCO.2006.06.4642. [DOI] [PubMed] [Google Scholar]
- 3.Alvaro T, Lejeune M, Salvadó MT, Lopez C, Jaén J, Bosch R, Pons LE. Immunohistochemical patterns of reactive microenvironment are associated with clinic-biologic behavior in follicular lymphoma patients. J Clin Oncol. 2006;24:5350–5357. doi: 10.1200/JCO.2006.06.4766. [DOI] [PubMed] [Google Scholar]
- 4.Glas AM, Knoops L, Delahaye L, Kersten MJ, Kibbelaar RE, Wessels LA, van Laar R, van Krieken JH, Baars JW, Raemaekers J. Gene-expression and immunohistochemical study of specific T-cell subsets and accessory cell types in the transformation and prognosis of follicular lymphoma. J Clin Oncol. 2007;25:390–398. doi: 10.1200/JCO.2006.06.1648. [DOI] [PubMed] [Google Scholar]
- 5.Farinha P, Al-Tourah A, Gill K, Klasa R, Connors JM, Gascoyne RD. The architectural pattern of FOXP3-positive T cells in follicular lymphoma is an independent predictor of survival and histologic transformation. Blood J. 2015;115:289–295. doi: 10.1182/blood-2009-07-235598. [DOI] [PubMed] [Google Scholar]
- 6.Yang ZZ, Grote DM, Ziesmer SC, Xiu B, Novak AJ, Ansell SM. PD-1 expression defines two distinct T-Cell subpopulations that differentially impact patient outcomes in follicular lymphoma. Blood. 2013;122:366–366. doi: 10.1038/bcj.2015.1. [DOI] [PMC free article] [PubMed] [Google Scholar]
- 7.Saifi M, Aurélie M, Pierre R, Marie CP, Philippe Q, Guillaume C, Jean FR, Valérie C. High ratio of interfollicular CD8/FOXP3-positive regulatory T cells is associated with a high FLIPI index and poor overall survival in follicular lymphoma. Exp Therap Med. 2010;1:933–938. doi: 10.3892/etm.2010.146. [DOI] [PMC free article] [PubMed] [Google Scholar]
- 8.Koch K, Hoster E, Unterhalt M, Ott G, Rosenwald A, Hansmann ML, Engelhard M, Hiddemann W, Klapper W. The composition of the microenvironment in follicular lymphoma is associated with the stage of the disease. Hum Pathol. 2012;43:2274–2281. doi: 10.1016/j.humpath.2012.03.025. [DOI] [PubMed] [Google Scholar]
- 9.Smith SM. Dissecting follicular lymphoma: High versus low risk. Hematol Am Soc Hematol Educ Prog. 2013;1:561–567. doi: 10.1182/asheducation-2013.1.561. [DOI] [PubMed] [Google Scholar]
- 10.Amé-Thomas P, Hoeller S, Artchounin C, Misiak J, Braza MS, Jean R, Le Priol J, Monvoisin C, Martin N, Gaulard P, Tarte K. CD10 delineates a subset of human IL-4 producing follicular helper T cells involved in the survival of follicular lymphoma B cells. Blood J. 2015;125:2381–2385. doi: 10.1182/blood-2015-02-625152. [DOI] [PMC free article] [PubMed] [Google Scholar]
- 11.Rizzardi AE, Johnson AT, Vogel RI, Pambuccian SE, Henriksen J, Skubitz AP, Metzger GJ, Schmechel SC. Quantitative comparison of immunohistochemical staining measured by digital image analysis versus pathologist visual scoring. Diagn Pathol. 2012;7:42. doi: 10.1186/1746-1596-7-42. [DOI] [PMC free article] [PubMed] [Google Scholar]
- 12.Agrillo C, Piffer L, Bisazza A, Butterworth B. Evidence of two numerical systems that are similar in humans and guppies. PLoS One. 2012;7:1–8. doi: 10.1371/journal.pone.0031923. [DOI] [PMC free article] [PubMed] [Google Scholar]
- 13.Nieder A, Dehaene S. Representation of number in the brain. Ann Rev Nueurosci. 2009;32:185–208. doi: 10.1146/annurev.neuro.051508.135550. [DOI] [PubMed] [Google Scholar]
- 14.Benali A, Leefken I, Eysel UT, Weiler E. A computerized image analysis system for quantitative analysis of cells in histological brain sections. J Neurosci Methods. 2003;125:33–43. doi: 10.1016/s0165-0270(03)00023-2. [DOI] [PubMed] [Google Scholar]
- 15.Walker RA. Quantification of immunohistochemistry—Issues concerning methods, utility and semiquantitative assessment. Histopathology. 2006;49:406–410. doi: 10.1111/j.1365-2559.2006.02514.x. [DOI] [PubMed] [Google Scholar]
- 16.Hendricks JB, Rainer R, Munakata S. Computer assisted and visual methods of assessing cellular proliferation in tissue sections from non Hodgkin lymphoma. Anal Quant Cytol Histol. 2006;17:383–388. [PubMed] [Google Scholar]
- 17.Cooper L, Sertel O, Kong J. Feature-based registration of histopathology images with different stains: An application for computerized follicular lymphoma prognosis. Comput Methods Prog Biomed. 2009;96:182–192. doi: 10.1016/j.cmpb.2009.04.012. [DOI] [PMC free article] [PubMed] [Google Scholar]
- 18.Sertel O, Kong J, Catalyurek UV, Lozanski G, Saltz JH, Gurcan MN. Histopathological image analysis using model-based intermediate representations and color texture: Follicular lymphoma grading. J Signal Process Syst. 2009;55:169–183. [Google Scholar]
- 19.Niazi MKK, Downs-Kelly E, Gurcan MN. SPIE Medical Imaging. Orlando, USA: 2014. Hot spot detection for breast cancer in Ki-67 stained slides: image dependent filtering approach. [Google Scholar]
- 20.Brey EM, Lalani Z, Johnston C, Wong M, McIntire LV, Duke PJ, Patrick CW., Jr Automated selection of DAB-labeled tissue for immunohistochemical quantification. J Histochem Cytochem. 2003;51:5. doi: 10.1177/002215540305100503. [DOI] [PubMed] [Google Scholar]
- 21.Niazi MKK, Pennell M, Elkins C, Hemminger J, Jin M, Kirby S, Kurt H, Miller B, Plocharczyk E, Roth R, Ziegler R. SPIE Medical Imaging 2013. San Diego, USA: 2013. Entropy based quantification of Ki-67 positive cell images and its evaluation by a reader study. [Google Scholar]
- 22.Das H, Wang Z, Niazi MK, Aggarwal R, Lu J, Kanji S, Das M, Joseph M, Gurcan M, Cristini V. Impact of diffusion barriers to small cytotoxic molecules on the efficacy of immunotherapy in breast cancer. PLoS One. 2013;8:1–8. doi: 10.1371/journal.pone.0061398. [DOI] [PMC free article] [PubMed] [Google Scholar]
- 23.Chen T, Chefd’hotel T. Deep learning based automatic immune cell detection for immunohistochemistry images: Machine learning in medical imaging. Lect Notes Comp Sci. 2014;8679:17–24. [Google Scholar]
- 24.Parvin B, Yang Q, Han J, Chang H, Rydberg B, Barcellos-Hoff MH. Iterative voting for inference of structural saliency and characterization of subcellular events. IEEE Trans Image Process. 2007;16:615–623. doi: 10.1109/tip.2007.891154. [DOI] [PubMed] [Google Scholar]
- 25.Qi X, Xing F, Foran DJ, Yang L. Robust segmentation of overlapping cells in histopathology specimens using parallel seed detection and repulsive level set. IEEE Trans Biomed Eng. 2011;59:754–765. doi: 10.1109/TBME.2011.2179298. [DOI] [PMC free article] [PubMed] [Google Scholar]
- 26.Arteta C, Lempitsky V, Noble J, Zisserman A. Learning to detect cells using non-overlapping extremal regions: Medical image computing and computer-assisted intervention—MICCAI 2012. Lect Notes Comp Sci. 2012;7510:348–356. doi: 10.1007/978-3-642-33415-3_43. [DOI] [PubMed] [Google Scholar]
- 27.Niazi MKK, Satoskar AA, Gurcan MN. SPIE Medical Imaging 2013. San Diego, USA: 2013. An automated method for counting cytotoxic T-cells from CD8 stained images of renal biopsies. [Google Scholar]
- 28.Jain AK. Fundamentals of Digital Image Processing. New Jersey: Prentice Hall; 1989. [Google Scholar]
- 29.Kapur JN, Sahoo PK, Wong AKC. A new method for gray-level picture thresholding using the entropy of the histogram. Comp Vis Graph Image Process. 1985;29:273–285. [Google Scholar]
- 30.Bland JM, Altman DG. Measuring agreement in method comparison studies. Stat Methods Med Res. 1999;8:135–160. doi: 10.1177/096228029900800204. [DOI] [PubMed] [Google Scholar]
- 31.Lin L. A concordance correlation coefficient to evaluate reproducibility. Biometrics. 1989;45:255–268. [PubMed] [Google Scholar]


