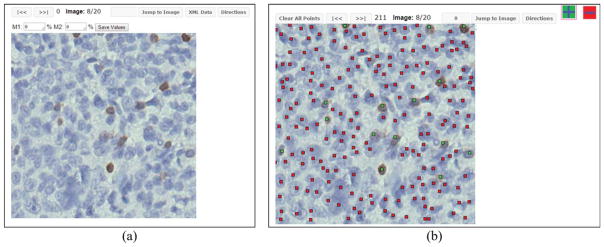
Figure 7.
Sample snapshots of the cell marking interface presented to readers for module 1 and module 2 of the reader study. (a) The interface where percentage estimates are entered through “eye balling” in module 1. This sample does not show the actual input from a reader. (b) Positive and negative cells are marked with different color markers in module 2. This sample does not show the actual input from a reader. [Color figure can be viewed at wileyonlinelibrary.com]

