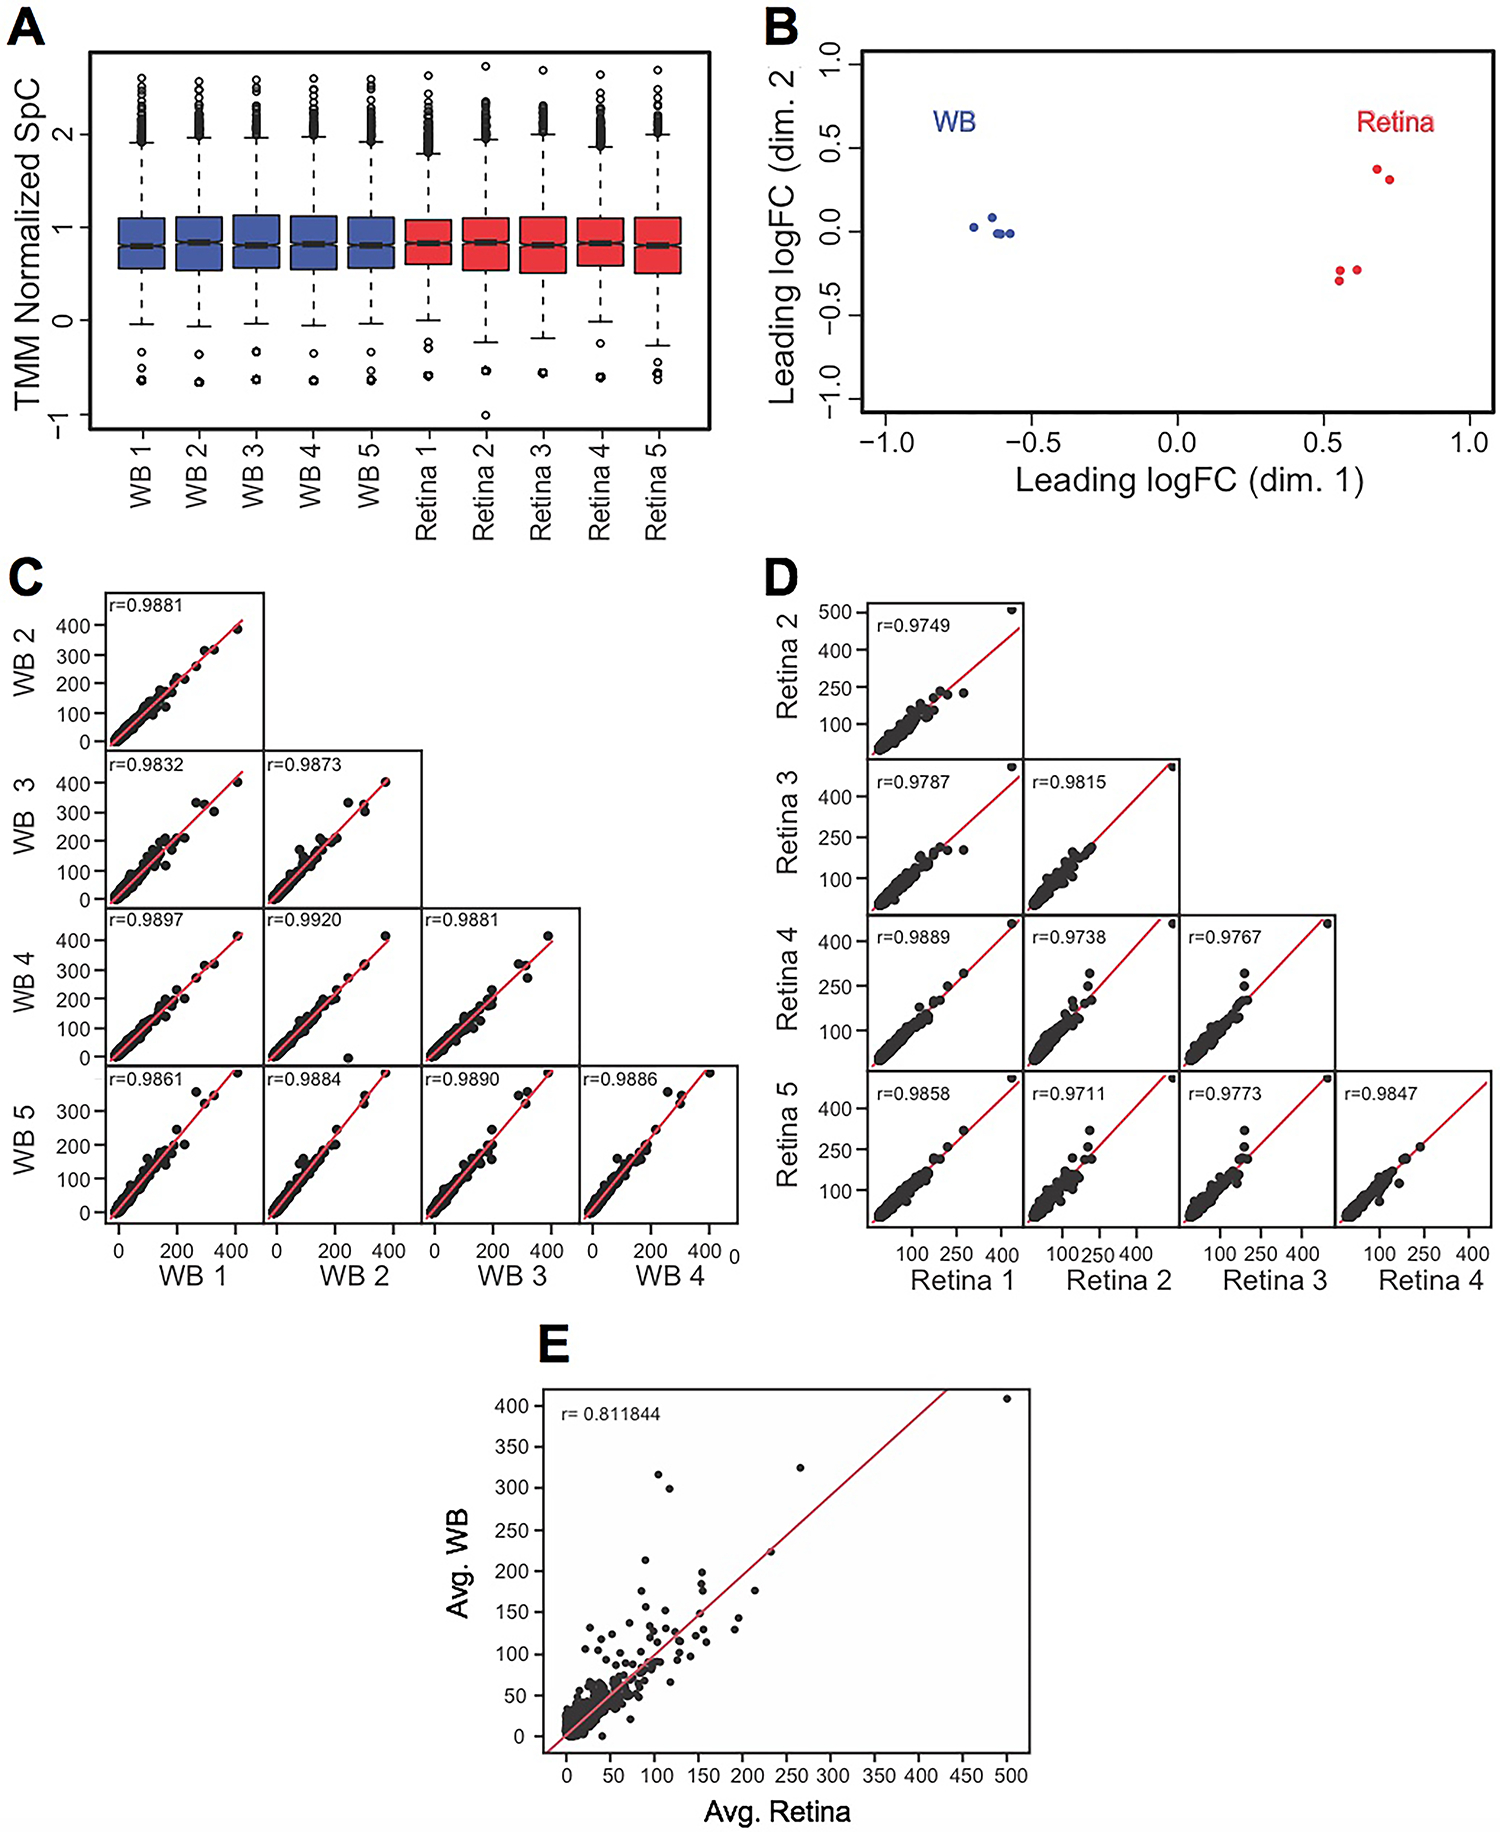
Fig. 2. Quality assessment of MS/MS data.

(A) TMM (trimmed mean of M-values) normalization of spectral counts in WB and retina samples using edgeR to correct for the dramatic compositional differences. The retina and the WB samples showed comparable median SpCs in boxplots (TMM normalized SpC are shown in y-axis). (B) Individual biological replicates of the retina and WB samples clustered together while the overall retina and WB samples clustered separately from each other in Multidimensional scaling analysis (leading dimensions 1 and 2 are represented by the axes). (C) Sample-to-sample consistency was examined by generating a scatter matrix for the five WB samples and (D) the five retina samples. (E) A scatter plot with regression analysis shows no correlation (r = 0.81) between the average retina and average WB samples.
