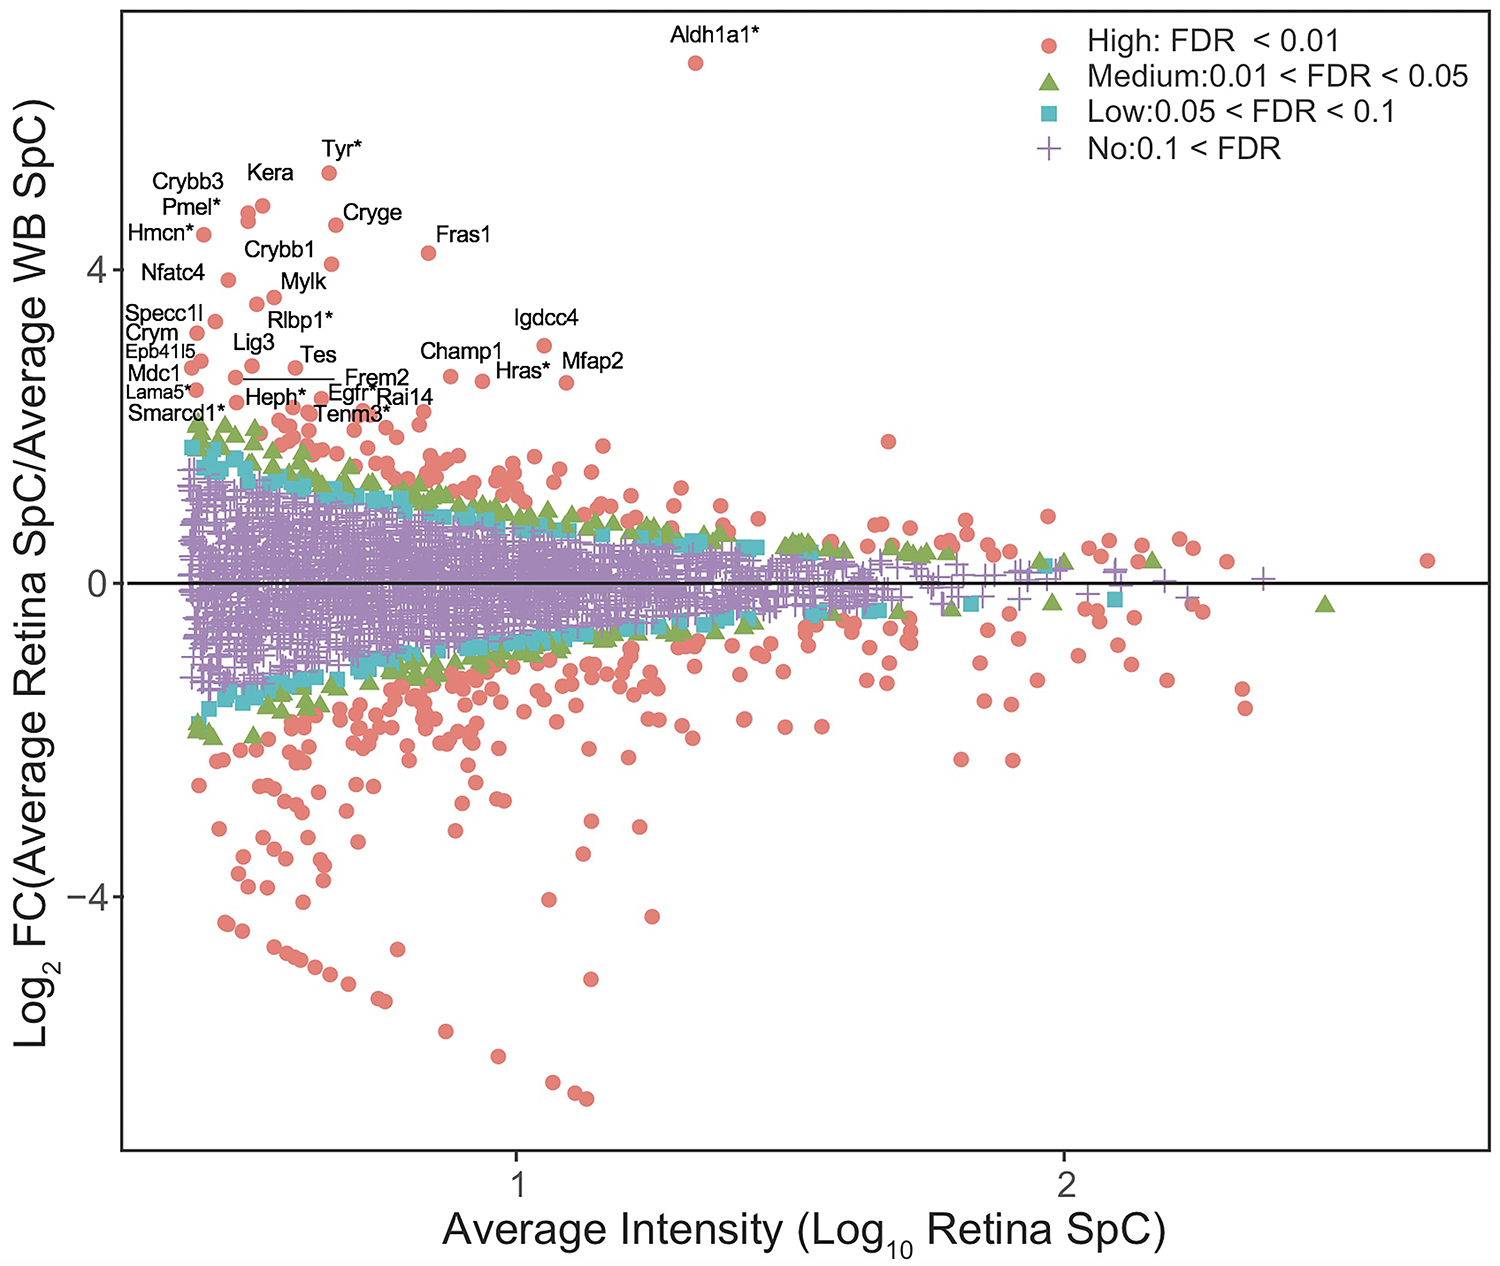
Fig. 4. In silico WB-subtraction identifies candidates with enriched expression in the mouse embryonic retina and retinal pigment epithelium combined tissue.

(A) Proteins with the average SpC ≥ 2.5 between retina and WB samples (n=2675) were further processed for identifying differentially expressed candidates. This analysis showed that 90 proteins were enriched in retina compared to WB ( ≥ 2.0 fold-change, FDR <0.01 cut-off). (B) MA plot (M = log ratio of retina to WB, A = average intensity) representation of differential protein expression profiling wherein the “high” (red, circle, FDR < 0.01), “medium” (green, triangle, 0.01 < FDR < 0.05), “low” probability retina-enriched (blue, square, 0.05 < FDR < 0.1) and non-enriched candidates (magenta, cross, 0.1 < FDR) are indicated. Several candidates associated with retinal defects (*) can be identified in this plot.
