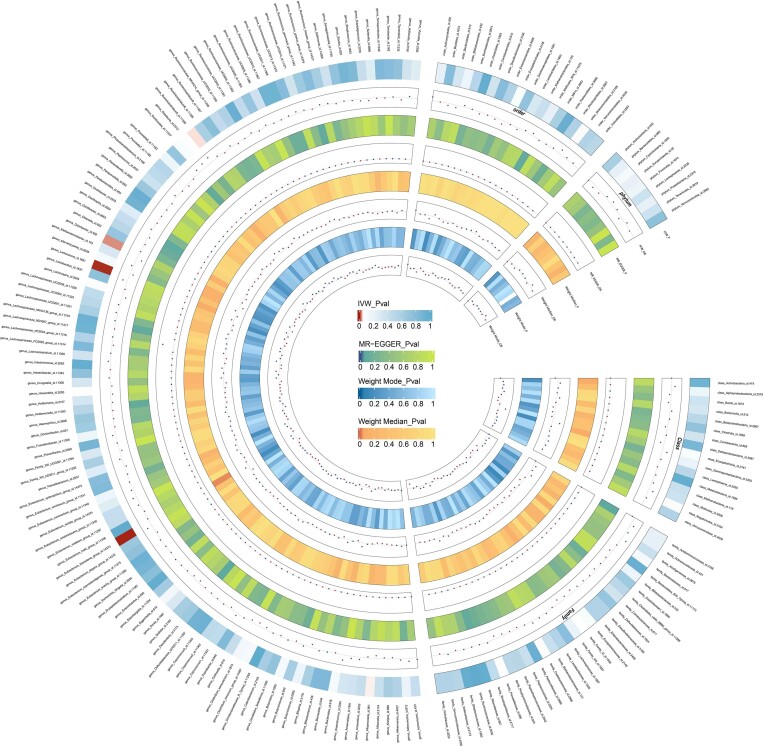
Figure 1.
Circus plot showing analysis results of all gut microbiota on Ps. The circular representation depicts the estimates obtained through the IVW, weighted media, and MR-Egger methods, moving from the outer to the inner circle. The classification of GM was based on order, phylum, class, family, and genus. The varying shades of color in the circle represent the magnitude of the P values, with the corresponding label inside the circle. Ps, Psoriasis; MR, Mendelian randomization; IVW, inverse variance-weighted; WM, weighted median. P < 0.05.

