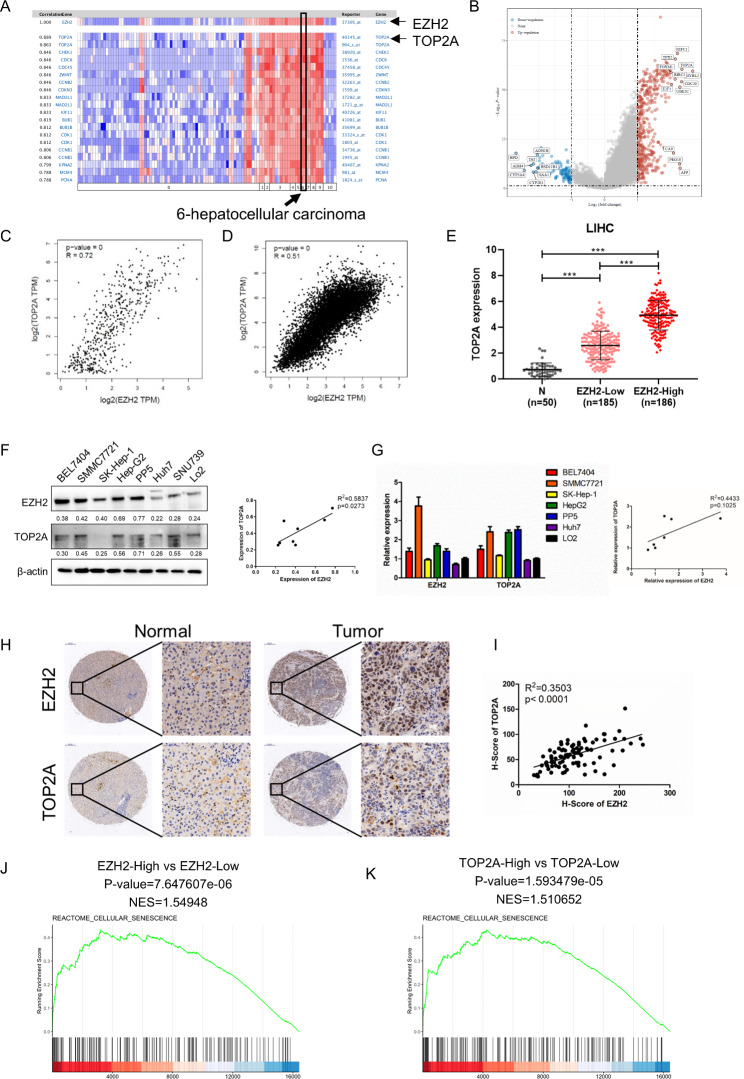
Fig. 1.
Coordinated expression of EZH2 and TOP2A in HCC. (A) Heatmap of genes correlated with EZH2 in cancers analyzed by the Oncomine database. (B) Volcano plot showing the differentially expressed genes of EZH2 in HCC by reanalyzing the RNA-seq data in the TCGA dataset using the limma package in R software. (C and D) Correlation analysis of EZH2 and TOP2A in HCC (C) and 31 tumors (including ACC, BLCA, BRCA, CESC, CHOL, COAD, DLBC, ESCA, GBM, HNSC, KICH, KIRC, KIRP, LAML, LGG, LIHC, LUAD, LUSC, MESO, OV, PAAD, PCPG, PRAD, READ, SARC, SKCM, STAD, TGCT, THCA, THYM, UCEC, UCS, and UVM) in TCGA (D). (E) TOP2A expression in normal tissues (n = 50), HCC tissues with low EZH2 expression (n = 185), and HCC tissues with high EZH2 expression (n = 186) by reanalyzing the RNA-seq data of HCC in the TCGA dataset using R software v4.0.3. (F) Western blot and (G) RT-qPCR analysis of EZH2 and TOP2A expression patterns in HCC cell lines. (H) Protein levels of EZH2 and TOP2A in HCC tissues and paired paracancerous tissues (n = 47) analyzed by IHC. GSEA of RNA-seq data from TCGA of EZH2 high expression versus EZH2 low expression (J) and TOP2A high expression versus TOP2A low expression using the Reactome cellular senescence gene set annotated in R-HSA-2,559,583. NES, normalized enrichment score. *p < 0.05, **p < 0.01, ***p < 0.001

