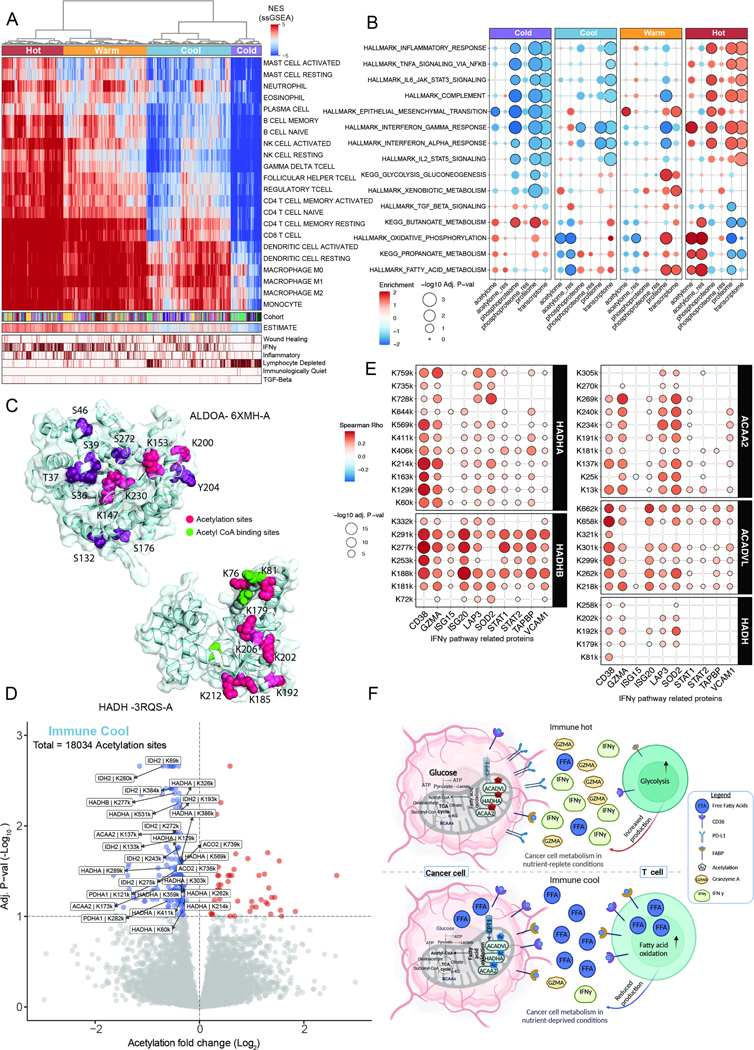
Figure 4 -.

PTM regulation of immuno-metabolism across cancers
A. ssGSEA hierarchical clustering for immune-related gene sets (heatmap) showing four immune clusters: hot to cold. Tracks represent ESTIMATE and ImmuneSubtypeClassifier annotations.
B. Bubble plot representing MSigDB Hallmark and KEGG pathways enrichment among the four immune subtypes.
C. Significant clustering based on CLUMPS-PTM of both acetylation and phosphorylation sites on ALDOA (top panel; PDB ID: 6XMH-A) in the immune-hot group, and clustering of decreased acetylation sites on HADH in the immune-cool cluster (lower panel; PDB ID: 3RQS-A). Phosphosites (purple), acetylsites (pink), and Acetyl CoA binding sites (green).
D. Volcano plot showing differential acetylation between the immune-cool subtype and the other immune clusters. Acetylation sites on fatty acid metabolism proteins are highlighted.
E. Bubble plot representing significant correlations between fatty acid beta oxidation enzymes acetylation sites and protein levels from the IFNγ pathway.
F. Schematic representation of PTM-based metabolic changes in immune-cool vs. immune- hot tumors showing key enzymes in the glycolysis and fatty acid beta oxidation pathways and their proposed effect on T cells.
