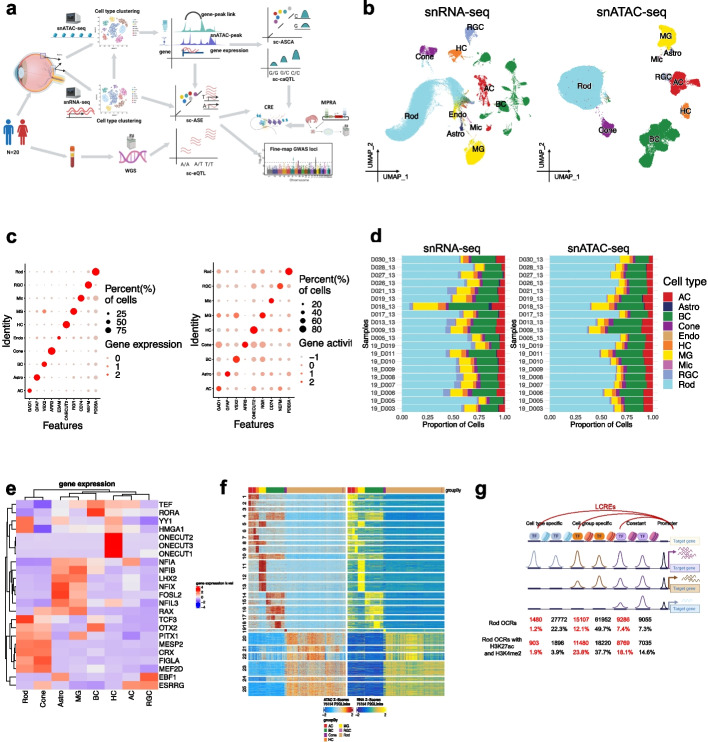
Fig. 1.
Profiling gene expression and chromatin accessibility of retinal cells. a Schematics of experiment design. b Uniform Manifold Approximation and Projection (UMAP) of cells from snRNA-seq and snATAC-seq. Each dot corresponds to a cell, colored by the annotated cell types. The same cell types from the two modalities are labeled with the same colors. n = 192,792 snRNA-seq cells. n = 245,940 snATAC-seq cells. c Dot plot showing the expression level and gene activity of marker genes for each major cell type, which were derived from snRNA-seq and snATAC-seq respectively. The dot color indicates the gene expression or activity level, while the dot size corresponds to the percentage of cells exhibiting that particular gene expression or activity. d Bar plot showing the distribution of cell type proportions across 20 donors based on snRNA-seq and snATAC-seq data respectively. Each cell type is represented by a distinct color. The number of cells per cell type per donor is listed in Additional file 2: Table S2. e Heatmap showing the gene expression level of the transcription factors across major retinal cell types. Those transcription factors were identified through chromVAR analysis and the correlation between motif enrichment and gene expression. f Heatmap showing the chromatin accessibility (left) and gene expression (right) of 75,154 significantly linked CRE-gene pairs across single-cell groups. Each row corresponds to a CRE-gene pair. Rows were clustered using k-means clustering (k = 25). Each column corresponds to a single-cell group. The color bar at the top of the heatmap indicates the cell type of a single-cell group. g The diagram showing proportions of Rod OCRs that are cell type-specific LCRE, cell type-specific non-LCRE, cell group-specific LCRE, cell group-specific non-LCRE, constant LCRE, and constant non-LCRE

