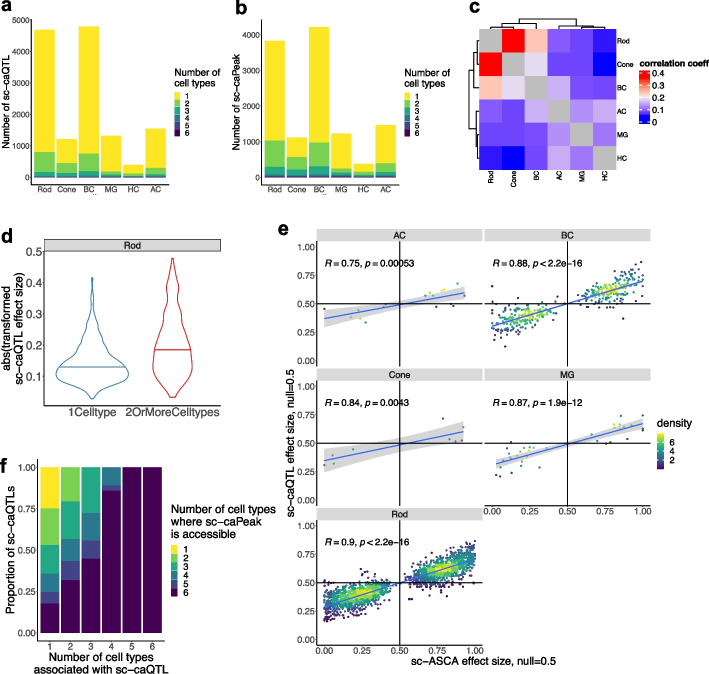
Fig. 4.
Identification of sc-caQTL in retinal cell types. a Bar plot showing the number of independent index sc-caQTLs reaching genome-level FDR < 0.1 per cell type, colored by the number of cell types where a sc-caQTL is significant. b Bar plot showing the number of sc-caPeaks reaching genome-level FDR < 0.1 per cell type, colored by the number of cell types where a sc-caPeak is significant. c Heatmap showing the Pearson correlation of sc-caQTL effect size across retinal cell types. d Violin plot showing the distribution of absolute effect size of the sc-caQTLs located in non-promotor OCRs identified in rod cells, colored by whether sc-caQTLs were identified in one (n = 6102) or more cell types (n = 2085). To compare the effect size of the two types of sc-caQTLs, two-sided Wilcoxon rank sum test was performed, . e Scatter plot showing the effect size of sc-ASCAs (X axis) and the population effect size of the overlapped sc-caQTLs (Y axis). The Pearson correlation coefficient and p-value are indicated in the figure. f Bar plot showing proportion of sc-caQTLs associated with sc-caQTLs that are significant in one or more cell types, colored by the number of cell types where the caPeak is accessible

