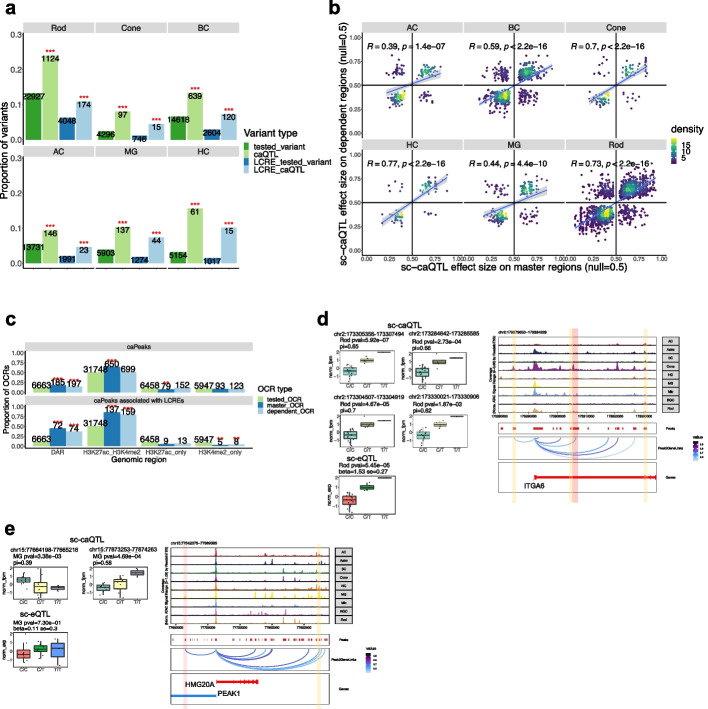
Fig. 6.
The sc-caQTLs can have effects on multiple genomic regions. a Bar plot showing the proportion of sc-caQTLs or the background variants affecting dependent OCRs and the proportion of sc-caQTLs or the background variants affecting dependent LCREs. The numbers of variants are indicated in the plot. Two-sided binomial test was performed to compare sc-caQTL with the background variants. “*”: 0.05 > p 0.01, “**”: 0.01 > p 0.001, “***”: p < 0.001. b Scatter plot showing the effect size of sc-caQTLs on master regions (X axis) and on dependent regions (Y axis). c Bar plot showing the proportion of the master or dependent OCRs that are DARs or have concurrent H3K27ac and H3K4me2 modifications in Rod. The numbers of caPeaks with different features are indicated in the plot. Two-sided binomial test was performed to compare the proportion of master_OCR or dependent_OCR with the proportion of tested_OCR. d Box plot showing the chromatin accessibility of one master OCR and three dependent OCRs in 20 individuals with different genotype of rs7596259 in Rod. Box plot showing the gene expression level of ITGA6 in 20 individuals with different genotype of rs7596259. Genome track of ITGA6 locus showing cell type-specific chromatin accessibility of the master OCR (red) and three dependent OCRs (yellow). The master OCR and one of the dependent OCRs are the predicted LCREs of ITGA6. e Box plot showing the chromatin accessibility of one master OCR and one dependent OCR in 20 individuals with different genotype of rs1493699 in Rod. Box plot showing the gene expression level of PEAK1 in 20 individuals with different genotype of rs1493699. Genome track of PEAK1 locus showing cell type-specific chromatin accessibility of the master OCR (red) and one dependent OCR (yellow). The master OCR and the dependent OCR are the predicted LCREs of PEAK1

