Fig. 7.
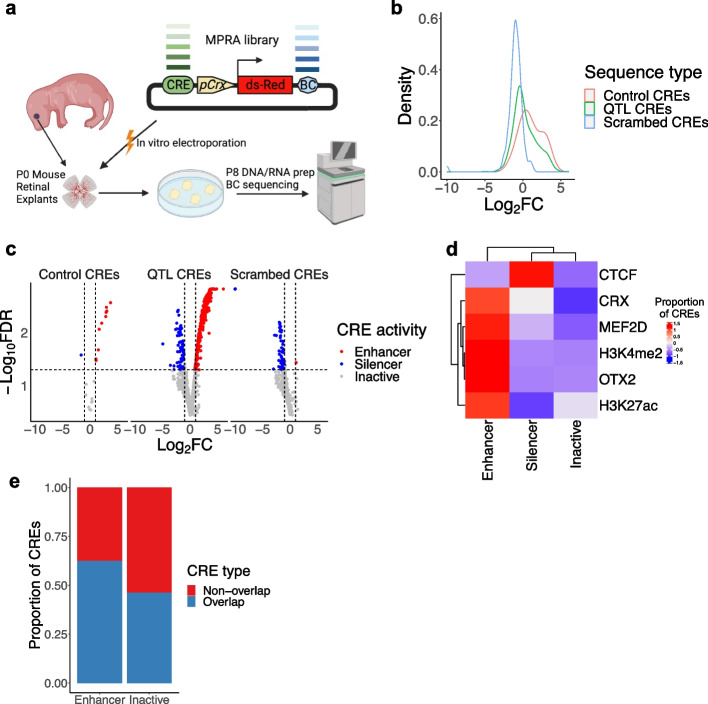
Massive parallel reporter assays (MPRAs) of cis-regulatory elements. a A schematic plot showing the workflow of MPRAs. b Density plot showing the distribution of values of the 1251 tested sequences, colored by the sequence type. c Volcano plot showing the value (X axis) and the value (Y axis) of each tested sequence (n = 1251). Each dot corresponds to a tested sequence, colored by the activity of the sequence. d Heatmap showing the scaled proportion of the regulatory sequences (i.e., Enhancer, Silencer, and Inactive) overlapped with different transcription factor bindings (i.e., CTCF, CRX, MEF2D, and OTX2) and histone modifications (i.e., H3K4me2 and H3K27ac). e Bar plot showing the proportion of the sequences with the co-binding of OTX2 and at least one of cell type/context-specific factors, CRX, NEF2D, and NRL (Overlap) and the remaining sequences (Non-overlap)

