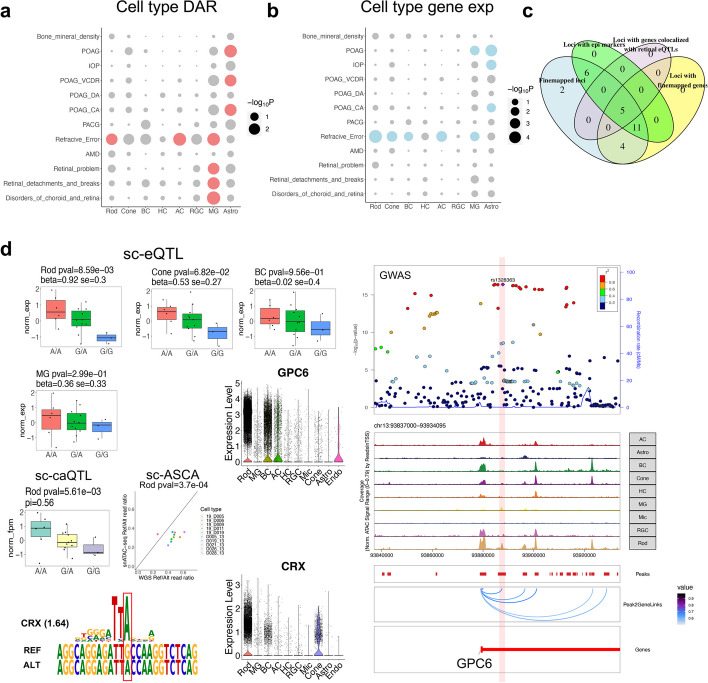
Fig. 8.
Cell type enrichment and causal variant prioritization underlying GWAS loci. a Dot plot showing the enrichment of 11 eye-related and one control GWAS loci in the DARs of retinal cell types, identified by LDSC. POAG: primary open-angle glaucoma. IOP: intraocular pressure. VCDR: vertical cup-disc ratio of optic nerve. CA: cup area of optic nerve. DA: disc area of optic nerve. PCAG: primary angle closure glaucoma. AMD: age-related macular degeneration. The cell types enriched of GWAS traits with q-value < 0.1 are highlighted in red. b Dot plot showing the enrichment of 11 eye-related and one control GWAS loci, based on cell type specificity of gene expression derived from snRNA-seq data with MAGMA.Celltyping. The cell types enriched of GWAS traits with q-value < 0.1 are highlighted in blue. c Venn diagram showing the features of the fine-mapped GWAS loci that are overlapped with sc-QTL and/or sc-ASCA. d Box plot showing the gene expression level of GPC6 in 20 individuals with different genotype of rs1328363 in Rod, Cone, BC, and MG. Box plot showing the chromatin accessibility of the OCR harboring rs1328363 in 20 individuals with different genotype of rs1328363 in Rod. Scatter plot showing the WGS Ref/Alt read ratio (X axis) and snATAC-seq Ref/Alt read ratio (Y axis) of rs1328363 in the individuals who are heterozygous for this variant. Violin plot showing the gene expression level of GPC6 and CRX across retinal cell types (n = 50,000). CRX motif position weight matrix aligned to reference and alternative allele at rs1328363. A LocalZoom plot showing the refraction error and myopia GWAS signal, , of rs1328363 and the surrounding SNPs. Genome track of GPC6 locus showing cell type-specific chromatin accessibility and positioning of rs1328363 within an OCR, which is a predicted LCRE of GPC6

