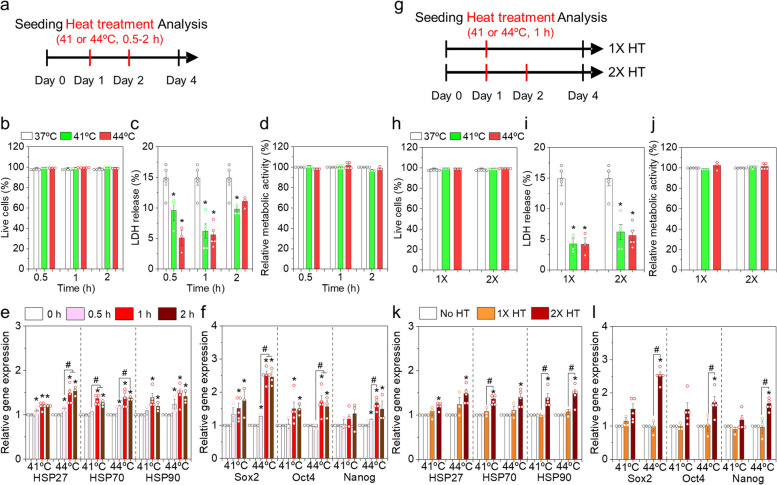
Fig. 2.
Mild HT of AD-MSCs for varying durations (a – f) and repetition (g – l) in a single passage. a An experimental scheme to study the effects of HT duration. b Live cell percentage, c LDH levels, and d relative metabolic activities of MSCs in each group. Gene expression levels of e HSPs and f stemness markers. g An experimental scheme to study the effects of HT repetition. h Live cell percentage, i LDH levels, and j relative metabolic activities of MSCs in each group. Gene expression levels of k HSPs and l stemness markers. Gene expression levels were normalized with the control (37ºC). Error bars represent the average ± the standard error of the mean from three to five experiments. *p < 0.05 compared to the control group, and #p < 0.05 compared to two groups

