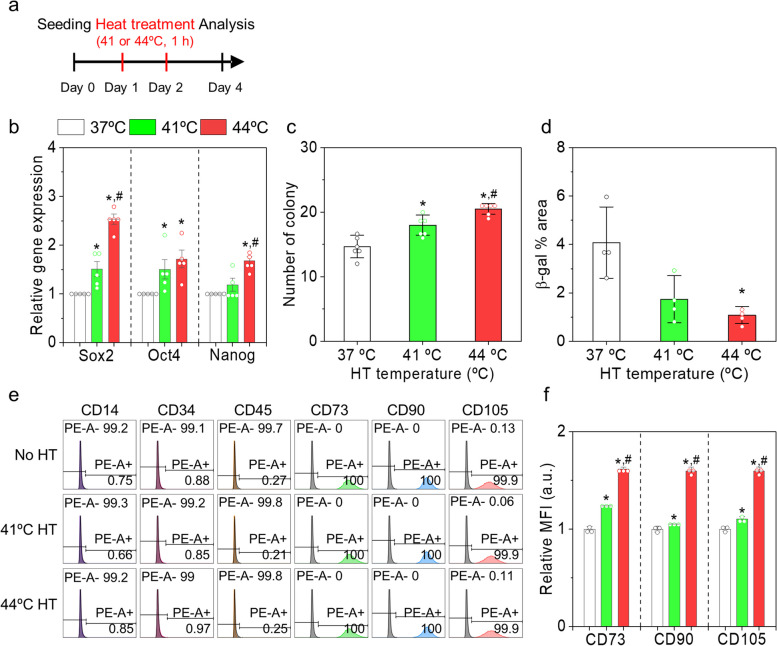
Fig. 3.
Effects of mild HT on stemness of human AD-MSCs. a Schematic representation of the experimental design. b Relative gene expression of SOX2, OCT4, and NANOG, c the number of colonies, and d β-galactosidase (β-gal) stained area in each group. e Flow cytometry of the MSCs stained with negative markers (CD14, CD34, and CD45) and positive markers (CD73, CD90, and CD105). f Mean fluorescence intensity (MFI) of the positive marker-stained MSCs in each group. *p < 0.05 compared to the control group, and #p < 0.05 compared to the HT 41ºC group

