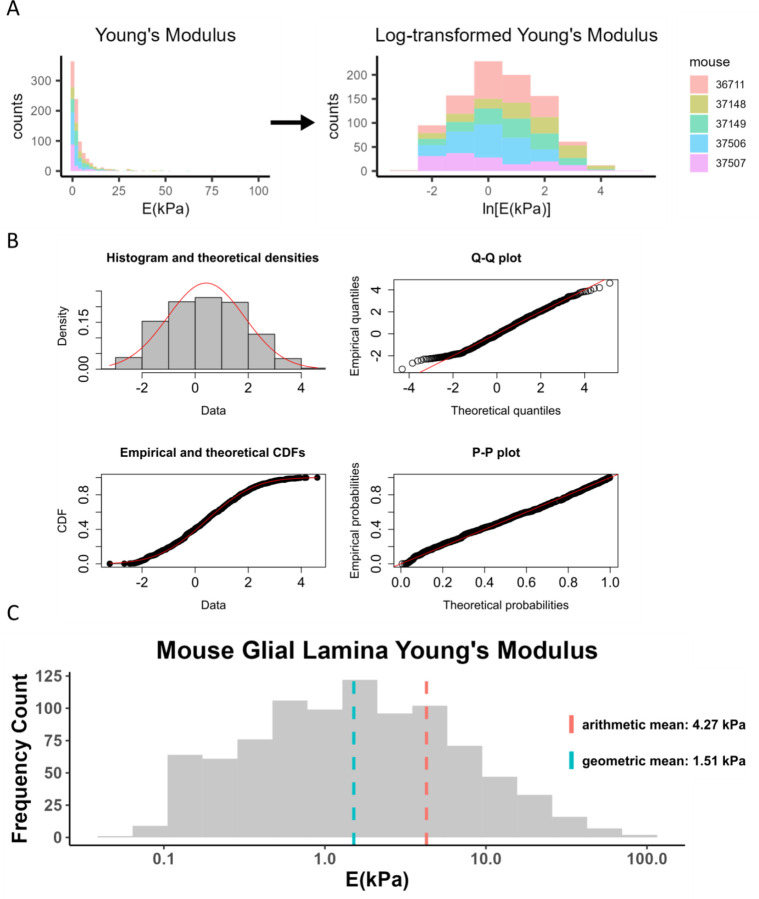
Figure 4: Log-transformation of Young’s modulus data from mouse glial lamina.
A) Histogram of Young’s modulus values from 9 eyes of 5 mice. The raw data was log-transformed to obtain a distribution that appeared to be consistent with a normal distribution. Each color represents data from one animal. B) The log-transformed Young’s modulus values appeared to be well-fit by a normal distribution, as judged by a histogram of Young’s modulus values vs. a fitted normal distribution (top left), and by comparisons of actual and theoretical quantiles (top right), actual and theoretical cumulative distribution functions (bottom left), and actual and theoretical probability distributions (bottom right). In all four panels, actual data is in black/grey and theoretical fits are overlain in red. C) Histogram of Young’s modulus values showing geometric and arithmetic means. The geometric mean, indicated by the blue dashed line, better represents the data compared to the arithmetic mean. X-axis is shown on a log-scale.

