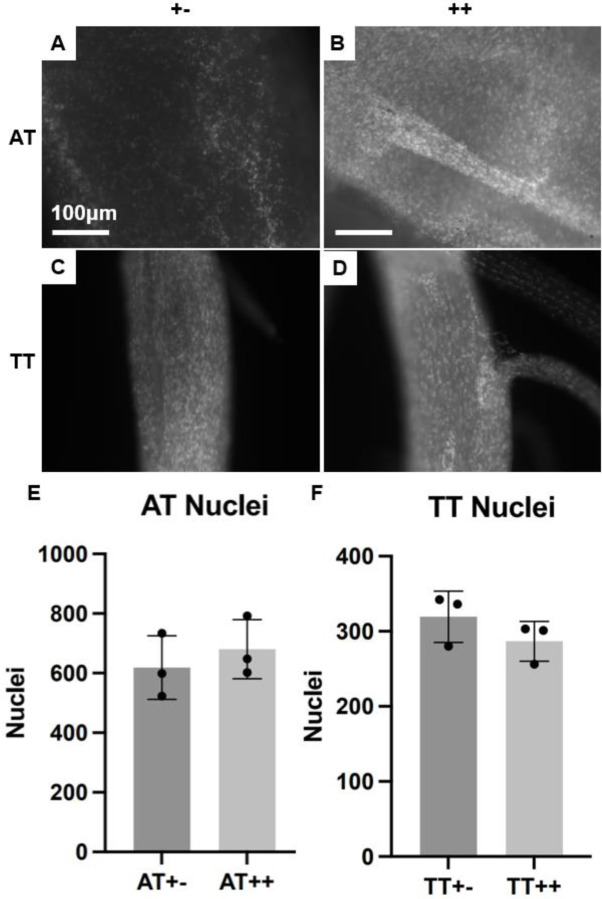
Figure 6.
(A-D) SHG micrographs of DAPI-stained nuclei in whole (A) control +− ATs, (B) dnKASH ++ ATs, (C) control +− TTs, and (D) dnKASH ++ TTs. (E, F) Counting the nuclei showed no significant differences between dnKASH and controls for either tendon type. All scale bars as shown. All images at 10x, scale bars = 100μm.

