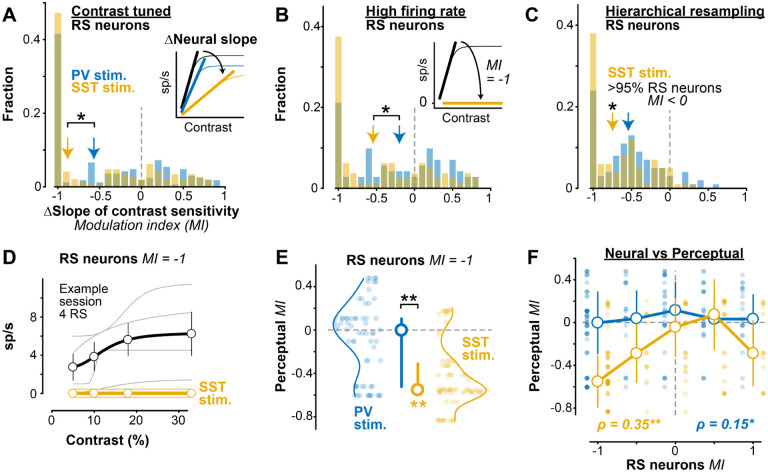
Figure 3. SST activation simultaneously reduces neural and perceptual contrast sensitivity A.
SST stimulation significantly decreased contrast response function slope (inset) in contrast tuned RS neurons (−0.88 ± 0.54 MI, median ± MAD, 146 RS neurons; , Wilcoxon signed rank test), and significantly more than did PV stimulation ( excitatory neurons; PV vs SST, , 1 -tail Wilcoxon rank-sum test).
B. Same as A for RS neurons with high firing rate (> 3 spikes/s, population median). Larger slope decrease with SST (−0.54 ± 0.53 MI, 80 RS neurons) versus PV stimulation (−0.20 ± 0.50 MI, 71 RS neurons; PV vs SST, . Inset shows schematic for neurons that become contrast insensitive (MI = −1) with SST stimulation (38% of neurons with SST stimulation; 21% of neurons with stimulation; , Fisher’s exact test).
C. Hierarchical bootstrapping verified robustness of RS slope changes. SST stimulation significantly decreased the slope of RS neurons of bootstrapped samples had a decrease in slope), but distal PV stimulation did not significantly decrease the slope of RS neurons .
D. Response of 4 example simultaneously recorded RS neurons with a neural slope MI = −1 during distal SST stimulation. Spiking activity decreased to 0 across contrasts (individual curves offset from 0 for visualization). Corresponding behavioral slope MI = −0.57. Mean ± SEM.
E. The corresponding perceptual MI for neural MI = −1 (68 RS neurons during SST stimulation, 64 RS neurons during PV stimulation). Significant decrease in perceptual MI with SST stimulation (−0.55 ± 0.24 MI, median ± MAD; , Wilcoxon signed-rank test), but not PV stimulation ( . Median ± IQR.
F. Changes in neural and perceptual slope of contrast sensitivity more strongly correlated during SST stimulation , Spearman’s rank correlation) than distal PV stimulation .

