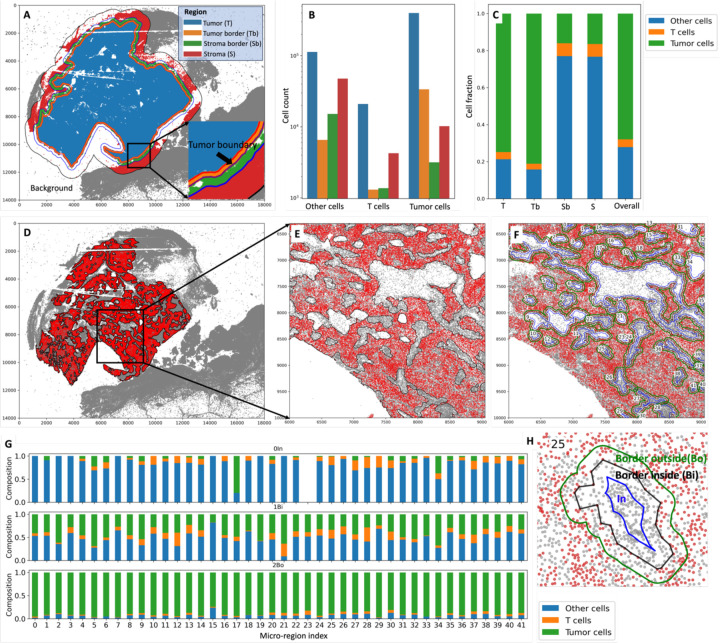
Figure 5.
Macro-region analysis (A, B, and C) and micro-region analysis (D, E, F, G, and H).
A. The overall region of interest is divided into four subregions: Tumor (T), Tumor border (Tb), Stroma border (Sb), and Stroma (S). The tumor region boundary is 100 microns away from the tumor boundary; the stroma border region boundary is 200 microns away from the tumor boundary; the boundary for the overall region of interest is 800 microns away from the tumor boundary. Users can specify these distances based on their needs. B. The corresponding counts of tumor cells, T cells, and other cells in the four regions. C. The cell fraction among all cells within each region. D. The micro regions within the tumor area. E. The zoomed-in micro regions. Each micro-region is indexed, allowing users to pick the ones of interest. F. Each micro-region boundary is extended and shrank (offset = 30 microns) to get the “In”, “Border inside”, and “Border outside” subregions, as shown in H. G. Cell compositions within the three subregions for each micro-region.

